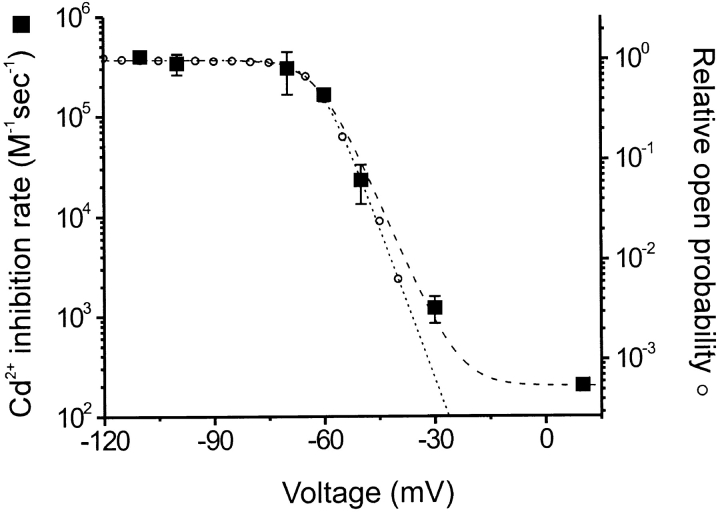
Figure 3.
Voltage dependence of the Cd2+ inhibition rate of 464C channels. Rate constants (closed squares) are plotted as a function of voltage (means of three to five experiments at each voltage; bars indicate ±SEM). Relative open probabilities (open circles) obtained from tail current measurements are shown for comparison (means of five experiments). The dotted line is a Boltzmann function fit to the relative open probabilities, assuming that open probability goes to zero with increasing depolarization. The dashed line is a Boltzmann function fit with the Cd2+ inhibition rates, with a minimum rate of ∼200 M−1s−1.

