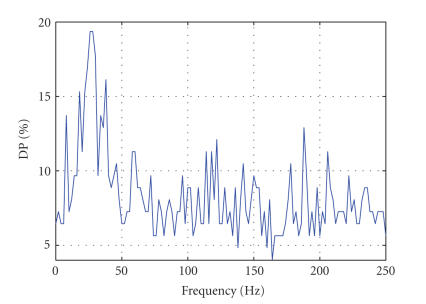
Figure 2.
Discriminative power (DP) versus frequency for the ENG1 data set. The panel represents the plot of maximum DP (best discrimination between left and right finger tappings) as a function of frequency. Peaks (DP > 12) are seen at alpha, beta, and gamma bands but also for very high-frequency bands (122 and 188 Hz).

