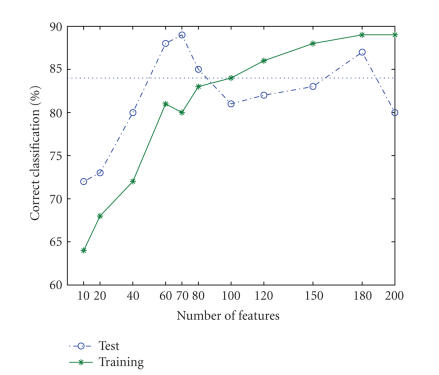
Figure 5.
Selecting the number of features for the BCI data set. The picture depicts the percentage (%) of correct classification (CC) on the training set (continuous trace) and the test set (discontinuous trace) as a function of the number of features. The number of features (180) is defined as the beginning of the first plateau, that is, where increasing the number of features does not increase CC on the training set.

