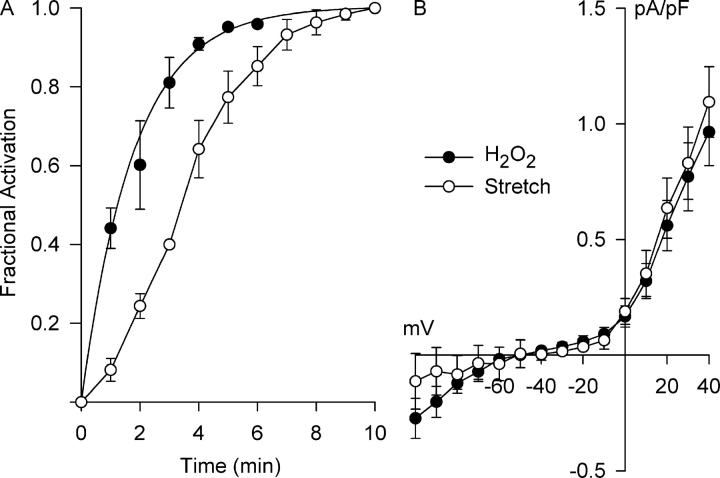
Figure 9.
Time course for Cl− SAC activation by H2O2 (500 μM) and integrin stretch and their respective steady-state I–V relationships. (A) The H2O2- and integrin stretch–induced currents at +40 mV were recorded at 1-min intervals and normalized by the steady-state currents to obtain the fractional activation. The time course for Cl− SAC activation by H2O2 was exponential with a time constant of 1.78 ± 0.13 min (n = 4), equivalent to a t1/2 of 1.24 ± 0.09 min. Cl− SAC activation by integrin stretch was slower, following a sigmoidal time course with a t1/2 of 3.5 ± 0.1 min (n = 5) (Browe and Baumgarten, 2003b). (B) Steady-state I–V relationships for the stretch- and H2O2-induced currents could not be distinguished.

