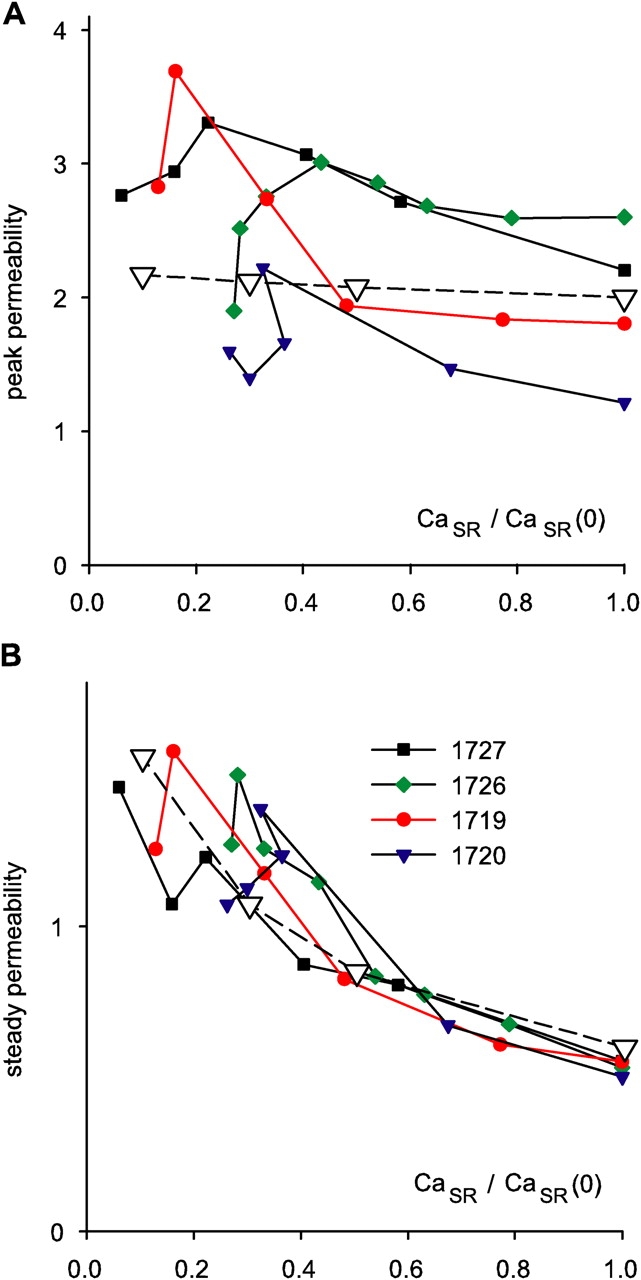
Figure 9.

Release permeability and SR content. Peak (A) and steady (B)  c
c
 t
t
 for different degrees of depletion, vs. normalized CaSR. Different symbols represent different experiments. Points are connected by lines in monotonic order of conditioning durations. Correction procedure performed with the lower estimate of SR content (Eq. 15). Peak and steady values of individual experiments were normalized to the average steady value in all realizations of the same experiment. The ordinate is therefore permeability (peak or steady) normalized to average steady permeability. The open symbols plot the outcome of a simulation with the model described in discussion (Eqs. 18, 20, and 22). The simulation generated time courses during a test depolarization to −45 mV at varying degrees of depletion. The activation variable x (Eq. 18) had transition voltage −40 mV, steepness factor 10 mV, and activation rate constant 0.02 ms−1 at the transition voltage. n was set to 8. In Eq. 20, k
f was 1.33 ms−1, k
r was 0.01 ms−1, and K/c
1 was 0.25 for the fully loaded SR, and then scaled in inverse proportion to load, at CaSR = 50%, 30%, and 10% of CaSR(0).
