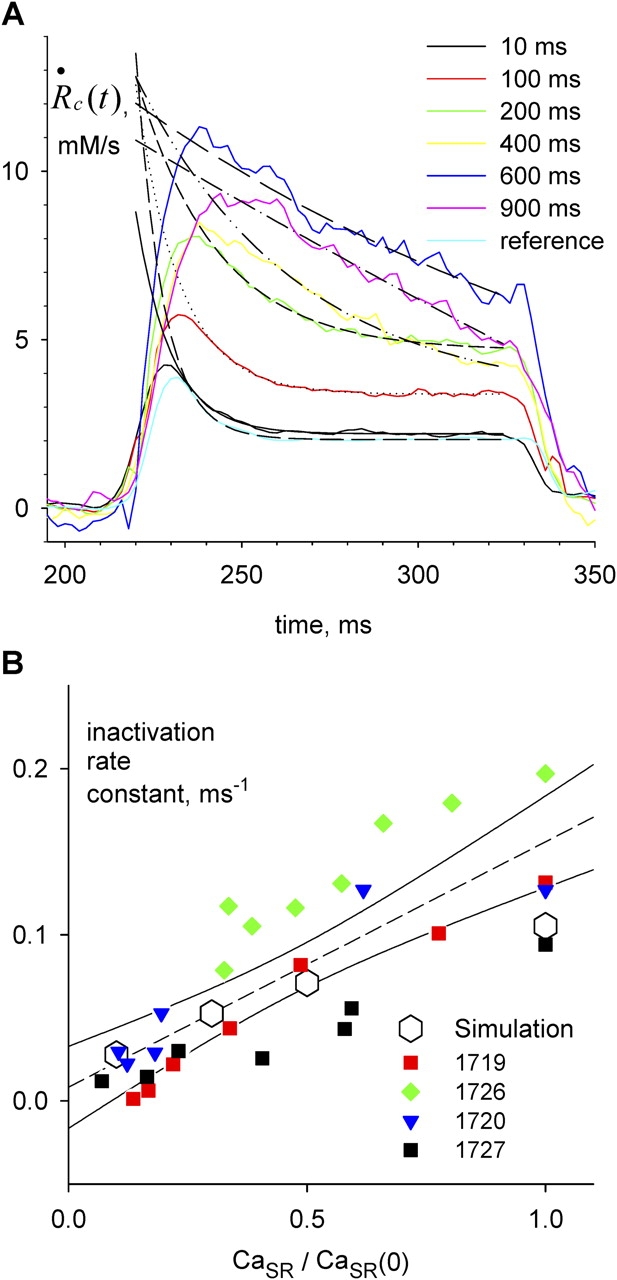
Figure 10.

SR depletion slows inactivation. (A)  c
c
 t
t
 transients elicited by test pulses, color coded to conditioning pulse durations. In black traces are superimposed single exponentials, fitted from the beginning of the region with positive curvature, as judged by eye, to the end of the test pulse. Fitted exponential rate constants are plotted vs. fractional SR content in B (red squares). The regression line through these points (not shown) has slope 0.149 ms−1, intercept −0.011 ms−1, and r
2 0.959. Identifier 1719. Removal model parameters had the same values as ID 1726, listed in legend of Fig. 6, except the following, which were adjusted for best fit: [EGTA] = 30 mM, [Parvalbumin] = 1 mM, k
on Ca EGTA = 5.00 μ M−1 s−1, k
off Ca EGTA = 5.00 s−1, maximum pump rate = 10 mM/s, pump dissociation constant for Ca2+ binding = 1.0 μ M. (B) Rate constants from all experiments in Fig. 9 plotted vs. fractional SR content. The dashed line is the linear regression through all the data in the plot, with slope 0.147 ms−1, intercept 0.008 ms−1, and r2 0.639. Open symbols represent rate constants of exponential fits to permeability transients simulated with the model described in discussion, using parameter values given in the legend of Fig. 9.
