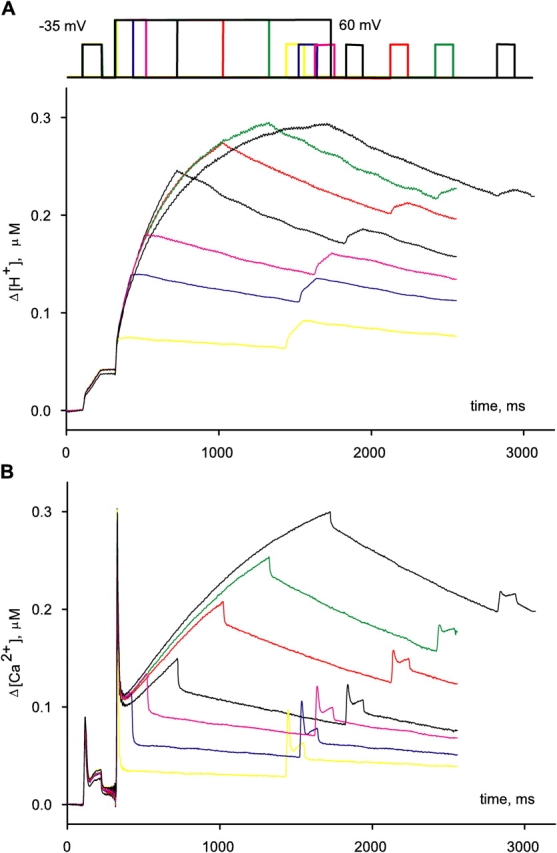
Figure 5.

Simultaneously measured Δ[H+](t) and Δ[Ca2+](t). Pulse patterns are represented schematically at top. Different applications, and the corresponding records, are identified by different colors. Pulse protocols consisted of a reference to −35 mV, a conditioning or depleting pulse to 60 mV, of variable duration, and a test, identical to the reference pulse, which followed 1,100 ms after the conditioning pulse. (A) Δ[H+](t), obtained by shifting [H+](t) determined according to Eq. 3. (B) Δ[Ca2+](t), derived from ΔA Ap(720). Identifier 1726, [ApIII] ranged between 0.71 and 1.05 mM. [phenol red], 2.63–3.16 mM. pH 6.65–6.48.
