
Figure 8.
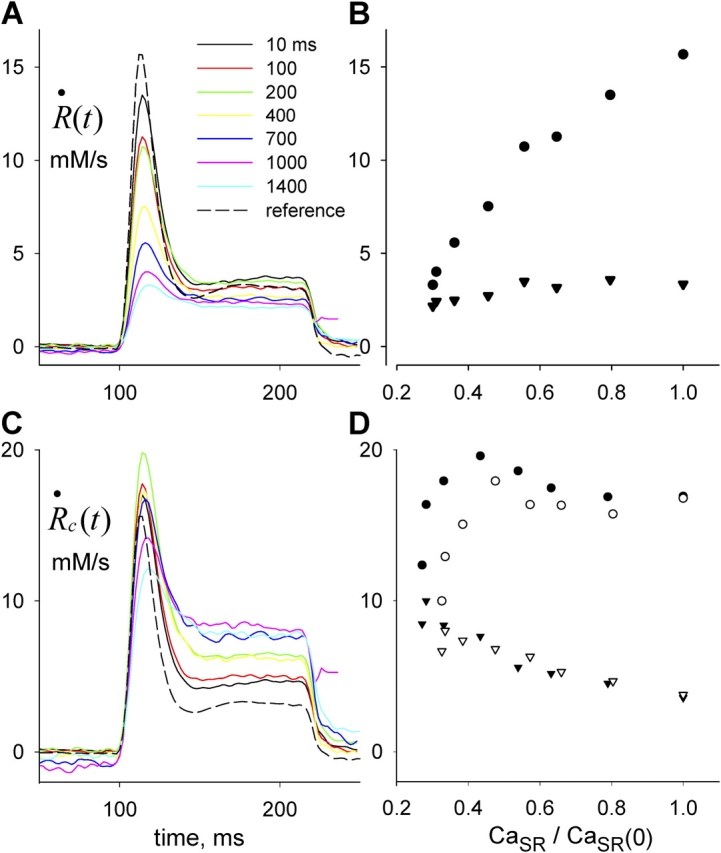
Release permeability changes with SR depletion. (A) Test release flux  ≲t
≲t
 following depleting pulses of various durations, as indicated. (B) Peak (circles) or steady value of level of
  ≲t
≲t
 , vs. CaSR normalized to its resting value. While the peak release flux is roughly proportional to CaSR, the steady value is nearly constant, indicating increase in steady permeability. (C) Corresponding
  c
c
 t
t
 , corrected according to Eq. 13 (“first approximation”). (D) Peak or steady values of
  c
c
 t
t
 , corrected according to Eq. 13 (filled) or Eq. A5 (open symbols). Both corrections yield qualitatively similar dependences. Identifier 1726.