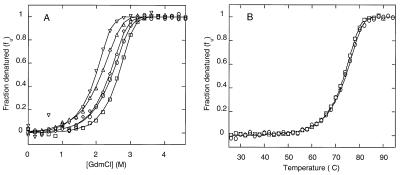
Figure 3.
(A) GdmCl denaturation (at 25°C and pH 7) of human p53tetS and some variants with natural mutations. The fraction of protein denatured is represented as a function of GdmCl concentration for wild-type tetS (□) and mutants L332V (▵), F341L (▿), L344I (⋄), and L332V/F341L/L344I (○). The protein (monomer) concentration was 40 μM. (B) Thermal denaturation (at pH 7) of human p53tetS (□) and the triple mutant L332V/341L/344I (○). The fraction of protein denatured is shown as a function of the temperature. The protein (monomer) concentration was 10 μM. For clarity, only 1 in every 10 experimental points is represented. The fitting of the experimental values to two-state transition curves by using the program Microsoft excel (method II in ref. 30) is indicated by solid lines.

