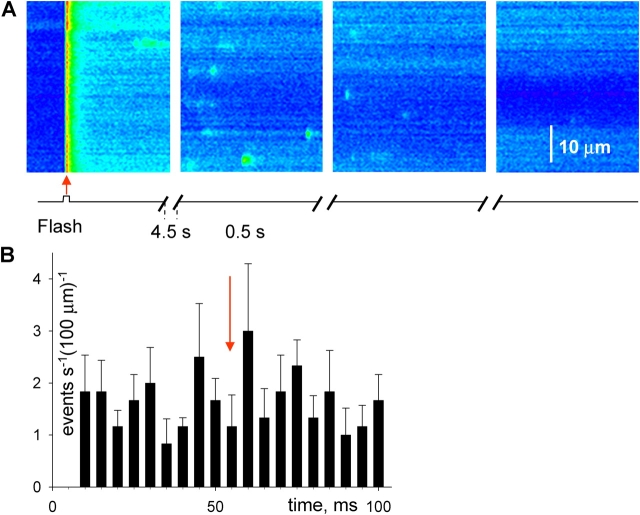
Figure 11.
Response to photorelease of Ca2+ in the rat. (A) Successive line scan images in a fiber equilibrated with a solution containing 0.5 mM NP-EGTA. Flash was applied at red arrow. (B) Diary plot of event frequency as a function of time, during images acquired at 5-s intervals. Flash was applied during the 10th image, at red arrow. Bars represent averages over five flashes applied in the same fiber; error bars span one SEM. Image identifier 082603e.

