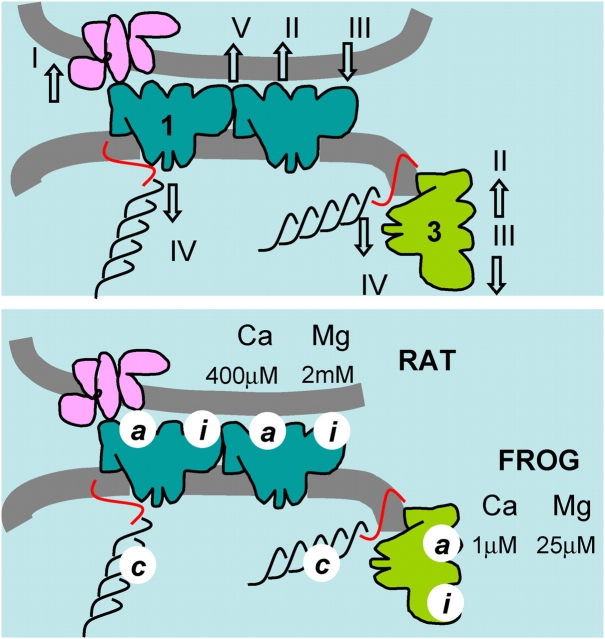
Figure 16.
Control of Ca2+ release. (Top) Actions required to explain the present results. RyR1 in blue, RyR3 in green. I, activation of RyR1 by the T membrane voltage sensor. II, activation (of RyR1 or 3) by Ca2+. III, inhibition by Mg2+. IV, basal inhibition (of either isoform) by interactions in vivo, attributed here to triadin (red) or calsequestrin (black). V, putative interchannel allosteric interaction, which could participate in the generation of sparks and/or contribute to effect IV. (Bottom) Dissociation constants derived in the present work. Values corresponding to high affinity binding of Ca2+ and Mg2+ explain results in the frog but not the rat; hence they are attributed to RyR3 exclusively. Low affinity activation by Ca2+ and inhibition by Mg2+ was observed in the rat only and is attributed to sites in its RyR1. The species names clarify these attributions in the figure.

