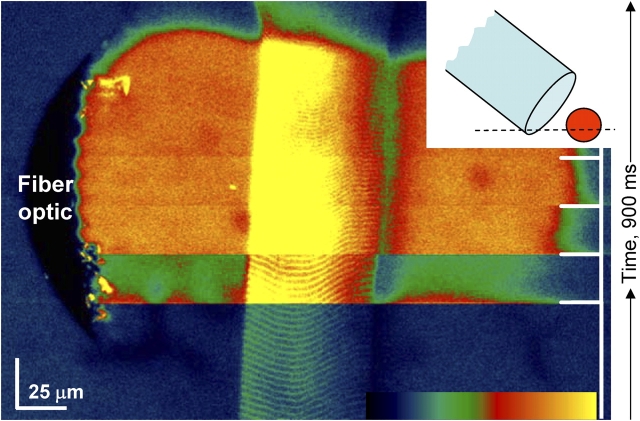
Figure 2.
Ca2+ photorelease in a muscle fiber. Raw confocal image of fluorescence. xy image was obtained at 2 ms per line, with time increasing in the upward direction. Solution contained 5 mM NP-EGTA at [Ca2+] of 150 nM. Four laser pulses of 355 nm were applied at the times indicated in the right side plot. Note optic fiber, as a zero-fluorescence crescent at left. The crescent shape results from the confocal section of a cylinder at ∼45°, at the level indicated by the dashed horizontal line in the inset diagram. Note the transient nature of the increase in fluorescence ([Ca2+]) produced by the first flash, and the sustained increase produced by the other flashes. Normalizations not shown indicate that the free [Ca2+] reached throughout the central segment of fiber and in the neighboring fluid are similar (the variable fluorescence reflects higher concentration of Ca2+ monitoring dye inside the fiber). Color table spans the interval 0–255. Image identifier 103001Bxy9.

