
Figure 3.
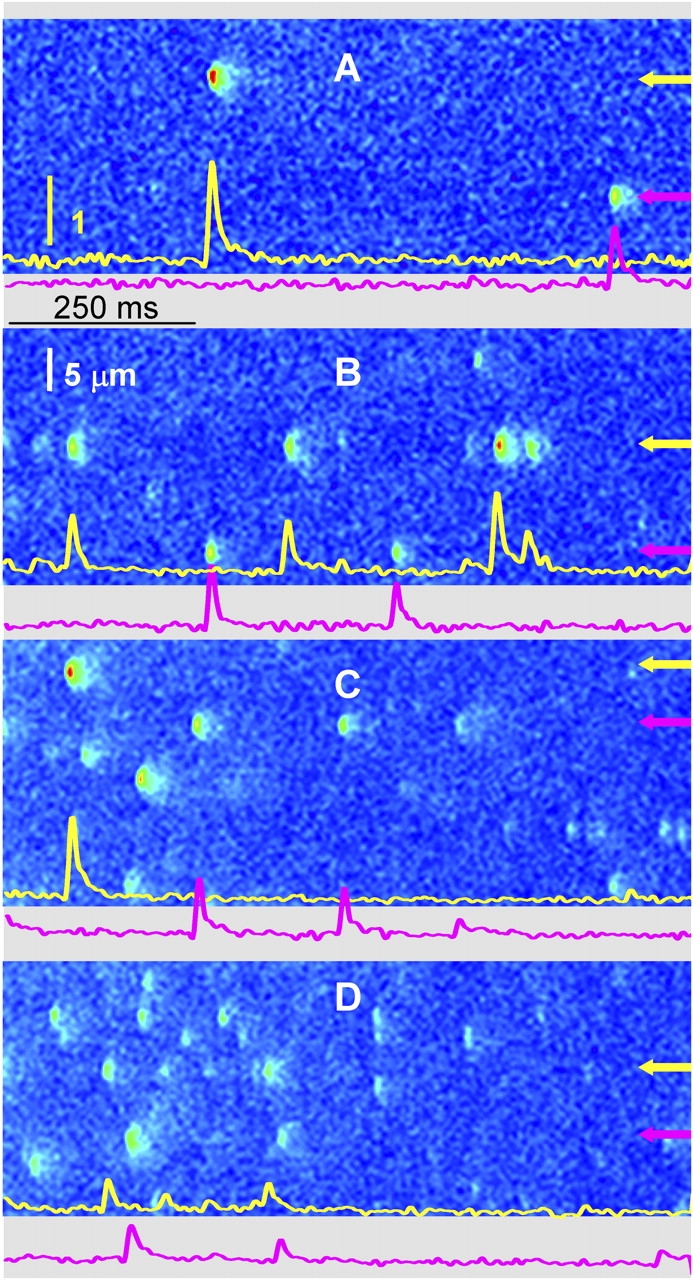
Line scans of fluorescence at different cytosolic [Ca2+] in frog fibers. Images are of fluorescence normalized to its resting average F 0 as described in materials and methods. [Ca2+]cyto = 100 nM (A), 200 nM (B), 400 nM (C), 800 nM (D). Panels are portions of images that were acquired in groups of 30 after solution changes. Because one cell was typically cycled through three different [Ca2+]cyto, the examples shown were chosen from two cells in the same muscle. The images at 100, 800, and 200 nM were acquired in that order from one cell; that at 400 nM from another cell in which 100 and 200 nM were also applied, with similar results. Traces are of F/F 0 averaged over five pixels (of 0.143 μm) centered at the positions indicated by arrows. The yellow vertical bar represents one unit of normalized fluorescence. Image identifiers: (A) 0718d1_29; (B) 0718d6_25; (C) 0718c4_30; (D) 0718d4_25.