Figure 1.
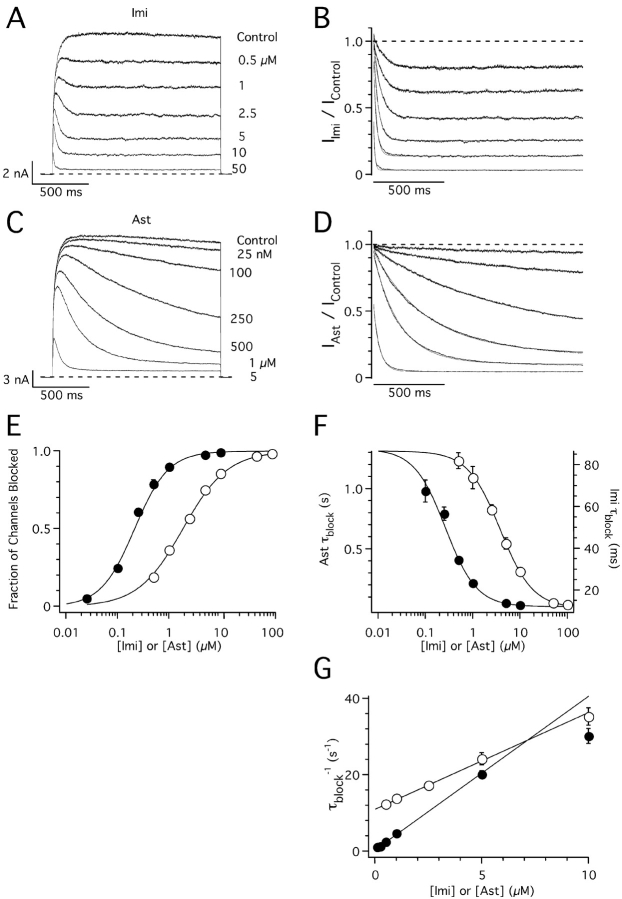
Concentration dependence of hEag1 block by imipramine and astemizole. (A and C) Superimposed hEag1 current traces recorded during 1.5 s test depolarizations to 80 mV from a holding potential of −70 mV in the absence and presence of the indicated concentrations of imipramine (Imi, A) or astemizole (Ast, C). Test potential was chosen to achieve the maximal open probability of hEag1, whose activation curve saturates above 60 mV (not depicted). The effects of drug application were monitored with test pulses applied every 30 s until a steady-state block was reached. (B and D) Current traces in the presence of imipramine or astemizole were normalized dividing them point by point by the respective preapplication traces. Solid lines indicate the best fit to a single exponential function. (E) Dose–response plots for imipramine (open circles) and astemizole (closed circles). The steady-state fraction of channels blocked was calculated from the asymptotic values of single exponential fits to current ratios as shown in B and D. Solid lines represent fits to the data using the Hill equation, with IC50 values and Hill coefficients of 1.87 μM and 1.04 for imipramine, and 0.21 μM and 1.32 for astemizole, respectively. (D) Time constant of block (τblock) for imipramine (open circles) and astemizole (closed circles) derived from the least-squares fits of single exponential functions used in E. Solid lines represent fits to the data using the Hill equations, with maximum, minimum, IC50, and Hill coefficients of 86.7 ms, 11.6 ms, 3.75 μM, and 1.27 for imipramine, and 1.33 s, 0.024 s, 0.26 μM, and 1.32 for astemizole, respectively. (G) The rate of current block is represented (τblock −1) as a linear function of nonsaturating imipramine (open circles) or astemizole (closed circles) concentrations. Solid lines represent fits to the data with a linear function, with slope and y intercept of 2.5 s−1μM−1 and 11.1 μM for imipramine, and 4 s−1μM−1 and 0.4 μM for astemizole, respectively. The range of drug concentrations used to fit τblock −1 data to the linear function was between 0.5 and 10 μM for imipramine and between 25 nM and 5 μM for astemizole. Symbols and associated error bars in E–G represent means ± SEM for six and seven cells for imipramine and astemizole, respectively.

