
Figure 5.
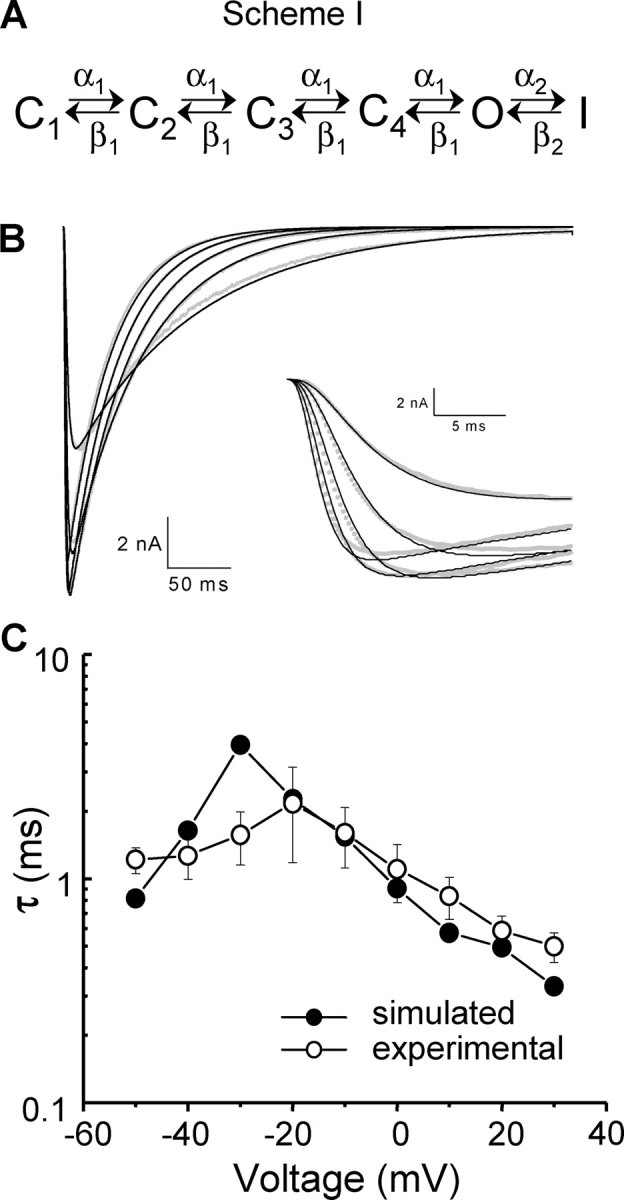
Kinetic simulations. (A) Sequential simplified model used for kinetic simulations. C1–C4 are four closed states, O is the open state, I is the inactivated state, and α1, α2, β1, and β2 are voltage-dependent transition rates between the states, as shown in the model. For simplicity, all transition rates in the activation pathway, C4 through O, were assumed to be equal. (B) Representative ionic current traces elicited by a family of 500-ms depolarizations from a −150-mV HP to voltages ranging from −40 to 0 mV in 10-mV steps, simultaneously fitted to the sequential model of NaChBac gating shown in A. Superimposed on the traces are the fitted curves. Inset, same as part B with expanded time scale. (C) Fit of predicted time course of gating currents compared with experimental data fits.