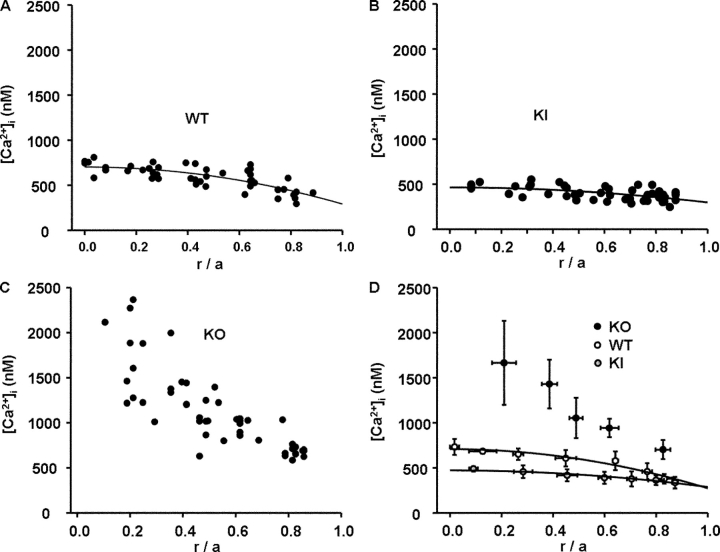
Figure 7.
A comparison of the distribution of [Ca2+]i in the three types of lenses. In each panel, the value of [Ca2+]i is graphed as a function of normalized distance from the lens center (r/a). The raw data in each panel represent measurement of [Ca2+]i at three to five depths in 10–12 different lenses. (A) Raw data from WT lenses. The data follow the smooth curve that was generated from the diffusion model (Eq. 3) and suggest a continuous increase in [Ca2+]i with increasing depth into the lens. Such a diffusion gradient is expected to be associated with a flux of Ca2+ from the center to surface of the lens. That flux would move from cell to cell through gap junction channels connecting the MF. (B) Raw data from KI lenses. The value of [Ca2+]i at the lens surface is similar to that in WT lenses, but the increase with depth is much less. The smaller diffusion gradient is thought to reflect the higher gap junction coupling in MF of the KI lenses (see Fig. 6 A), and not a difference in Ca handling. In the text, we estimate that the Ca flux in KI and WT lenses is the same. (C) Raw data from KO lenses. The MF of these lenses lack gap junctions, hence the efflux path to the surface does not exist and [Ca2+]i accumulates without the normal homeostatic mechanism of the circulation being present. (D) An overplot of the data from the three types of lenses. The data have been binned for clarity.

