
Figure 1.
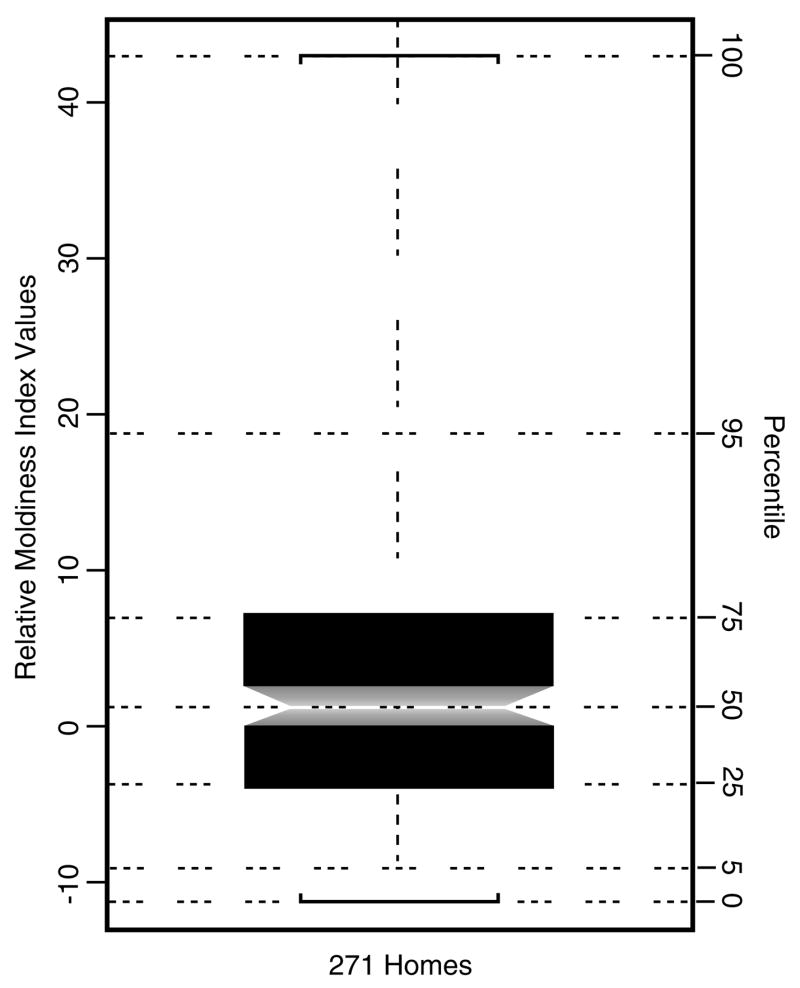
Notched box-plot of RMI values for all 271 study homes. The notch forms an approximate 95% confidence interval around the median. RMI values are shown along the left margin of the plot with corresponding percentiles of the empirical distribution shown along the right margin. This plot shows the overall range and distribution of the RMI values and illustrates the relationship between percentiles and corresponding quantiles.