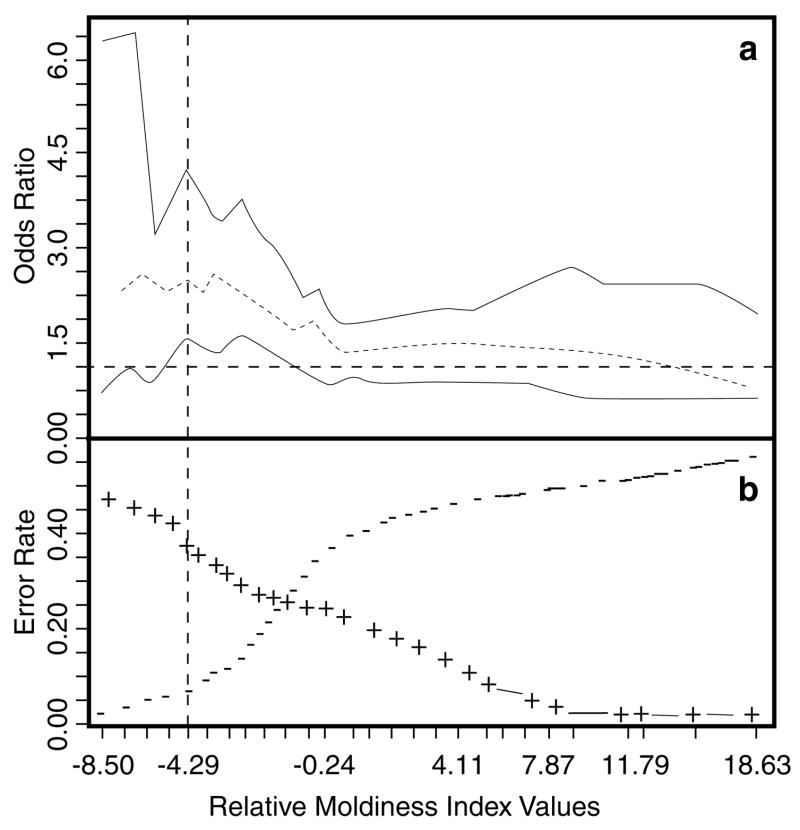
Figure 2.
(a) Plot showing odds ratios with 95% confidence interval spanning the quantiles corresponding to the middle 90% of the RMI distribution. (b) Prediction error rates from 10-fold cross-validation of logistic discriminant analysis using RMI values to predict illness (wheezing and/or rhinitis). The vertical line shows an example of an RMI threshold of −4.29 subsequently used for both predicting the incidence of illness (Table 2) and for dividing the homes into more moldy homes and less moldy homes (Table 3). False negatives are shown as minus signs and false positives as plus signs.

