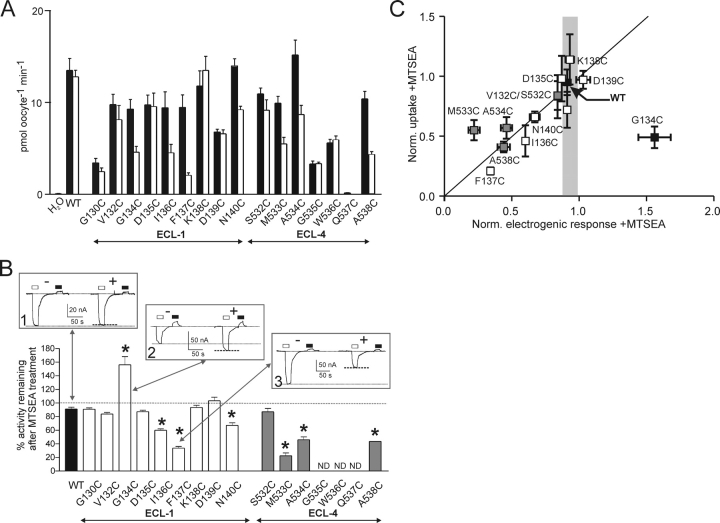
Figure 2.
Identification of functionally important sites in ECL-1 and ECL-4. (A) 32Pi uptake of WT and mutants before (filled bars) and after (unfilled bars) incubation for 10 min in 1 mM MTSEA (n ≥ 10 oocytes per group). (B) Remaining electrogenic activity (expressed as % of the initial response) after 3–5 min exposure to 1 mM MTSEA for n ≥ 3 oocytes/construct, measured at V h = −50 mV, ND100 ± 1 mM Pi. WT response, filled bar; mutants, open bars. ND (not determined) refers to mutants that gave an electrogenic response <−15 nA or no measurable response to 1 mM Pi in at least three batches of oocytes from different donor frogs. Insets show representative recordings from three oocytes voltage clamped to −50 mV that expressed the WT (1), G134C (2), and F137C (3), respectively, before (−) and after (+) incubation for 3 min in 1 mM MTSEA. The response of each oocyte to a 20-s application of 1 mM Pi (open bars) and 1 mM PFA (filled bars) was recorded. Dotted lines indicate peak of Pi-dependent response and holding current in ND100 to aid comparison. Asterisks indicate mutants that showed statistically significant deviations from the WT, as reported by an unpaired t test (P < 0.05), applied to the normalized data. (C) Comparison of activity after MTSEA exposure for mutants for which reliable electrophysiological data was available (ECL-1, empty squares; ECL-4, gray-filled squares; WT, filled square) normalized to control (−MTSEA) condition. Vertical error bars indicate SEM for normalized uptake data, horizontal error bars indicate SEM from data in B. Gray bar represents mean ± SEM to indicate change of electrogenic activity observed for WT-expressing oocytes after MTSEA exposure.

