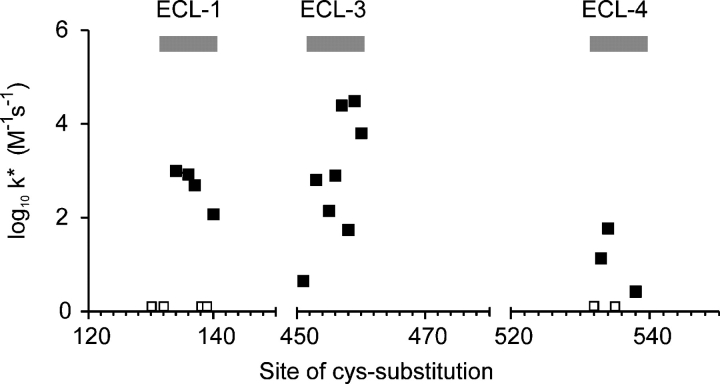
Figure 8.
Graphical representation of accessibility of three putative extracellular linkers based on effective second order reaction rate k* plotted on a logarithmic scale (filled squares). A larger k* indicates that the site has a greater accessibility from the external aqueous medium. Sites that were labeled with MTSEA-Biotin, for which the respective mutants showed no detectable change in activity, are indicated (empty squares). Data for ECL-1 and ECL-4 were obtained from this study (Table I); data for ECL-3 were replotted from a previous study (Lambert et al., 2001).

