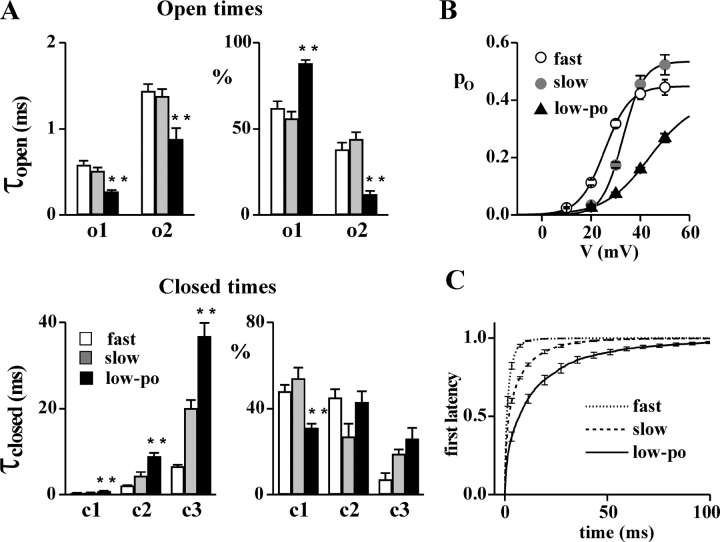
Figure 7.
Comparison of the gating parameters of the low-po gating mode of CaV2.1 channels lacking the β subunit and the slow and fast gating modes of CaV2.1 channels containing the β subunit. Cell attached recordings on HEK293 cells stably coexpressing human α1A-2, α2bδ-1, and different β subunits (for the slow and fast gating modes), or transiently expressing α1A-2 and α2bδ-1 subunits (for the low-po gating mode). (A) Time constants (τopen and τclosed) and relative areas (%) of the exponential components best fitting the open and closed time distributions at +30 mV of single CaV2.1 channels in fast (empty bar), slow (gray bar), and low-po (dark bar) gating modes. For the fast and slow gating modes, the values of CaV2.1 channels containing different β subunits from 18 (5 with β1b, 3 with β2e, 6 with β3a, and 4 with β4a) and 13 (5 with β1b, 4 with β2e, and 4 with β4a) single channel patches, respectively, were averaged; for the low-po gating mode, average values were obtained from six patches containing a single α1A-2–α2bδ-1 channel. Statistical significance of difference between the values for the low-po mode and both the slow and fast gating modes, using Student's t test: **, P < 0.001. (B) Average open probability as a function of voltage of single CaV2.1 channels containing different β subunits in either the fast (open circles, n = 18) or the slow (gray circles, n = 13) gating mode and of single α1A-2–α2bδ-1 channels in the low-po gating mode (triangles, n = 6) as in A. Fit of the activation curves with a Boltzmann equation gives for the low-po mode, V1/2 = 43.6 mV, k = 8.9 mV, po max = 0.40; for the fast mode, V1/2 = 26 mV, k = 5.2 mV, po max = 0.45; and for the slow mode, V1/2 = 33 mV, k = 4.2 mV, po max = 0.53. The different values of po max for the slow and fast gating modes (in contrast with the similar values in Fig. 1 C) are mainly due to different fractions of time spent by the channels in the b mode (Fellin et al., 2004). (C) Average cumulative first latency histograms of single α1A-2–α2bδ-1 channels in the low-po gating mode (from n = 6 single channel patches) and of single α1A-2–α2bδ–β1b channels in either the fast or the slow gating mode (from n = 5 and 5 single channel patches, respectively). To obtain the histograms, only sweeps with activity were considered. See text for the parameters of the exponential components best fitting the histograms.

