Figure 1.
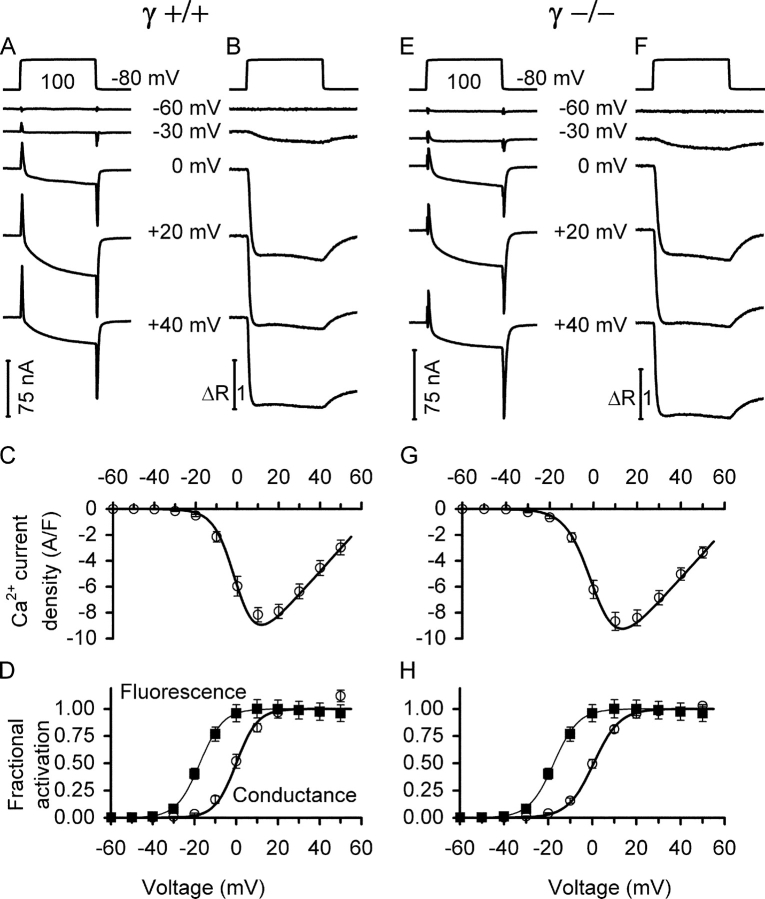
Voltage-activated slow Ca2+ inward current and myoplasmic Ca2+ signals. Comparison of L-type Ca2+ currents (A and E) and fura-2 fluorescence ratio signals (B and F) at five different pulse voltages for a γ+/+ and a γ−/− muscle fiber, respectively. The top traces show representative recordings of the applied voltage steps. C and G show leak-corrected current–voltage relations for several fibers, including measurements at more voltages. D and H show the voltage dependence of normalized activation of the Ca2+ signals (squares) and conductance (circles, derived from C and G, respectively) for the same set of measurements. Continuous lines are least squares fits of Eqs. 1 and 2 to the data points. Fit parameters for the Ca2+ signals were V 0.5 = −20.86 ± 1.56 mV and k = 5.79 ± 0.21 mV in γ+/+, and V 0.5 = −18.90 ± 1.46 mV and k = 5.22 ± 0.29 mV in γ−/−, exhibiting no significant difference. For other values see Table I. Values were determined as the average of the measurement points in the last 8 ms of the 100-ms depolarization. Data of 16 γ+/+ and 19 γ−/− muscle fibers, respectively.

