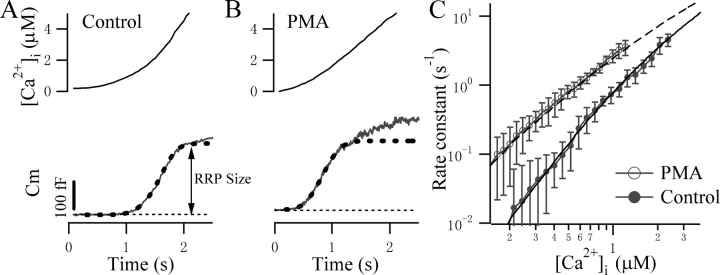
Figure 6.
PMA treatment reduces the steepness of the Ca2+ dependence of exocytosis revealed by ramp [Ca2+]i stimulation. Example Cm responses of a control (A) and PMA-treated (B) cells stimulated by ramp [Ca2+]i. The smooth dashed lines represent simulated responses using the models shown in Schemes 1 and 2 in the absence and presence of PMA, respectively. (C) Double logarithmic plot of the rate constants versus [Ca2+]i for 10 control (open circles) and 7 PMA-treated (filled circles) cells. The local rate constant was calculated as the exocytotic rate divided by the remaining pool size. The slope was 2.7 for the control and 1.6 for PMA-treated cells. Using the measured ramp [Ca2+]i as a forcing function, the control data were fitted to a three-step Ca2+-binding model (Scheme 1), whereas the PMA data were fitted to the two-step Ca2+-binding model (Scheme 2).

