Figure 5.
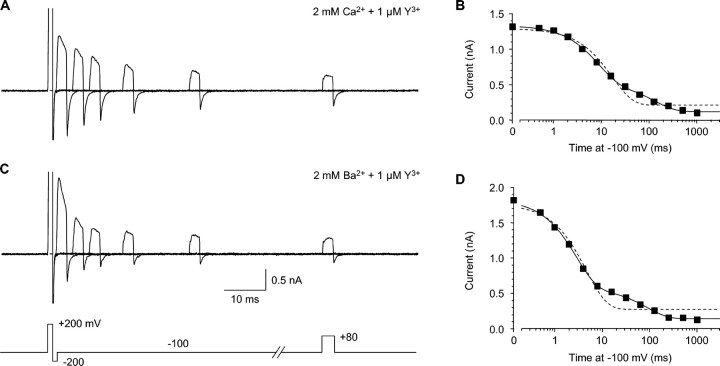
Reentry of Y3+ into closed channels. (A) Block by 1 μM Y3+ was reversed by 1 ms at +200 mV, followed by 1 ms at −200 mV, to close channels while minimizing reblock of open channels during the tail current (protocol shown in C). A pulse to +80 mV then tested channel availability, following a variable interval at −100 mV. Intervals of 0, 4, 8, 16, 32, and 64 ms are shown. Currents at +200 and −200 mV are off scale. 2 kHz Gaussian filter. (B) The time course of closed channel block, from the same experiment as A, on a log time scale. The data were fitted to a single exponential (dashed curve) or the sum of two exponentials (solid curve). (C and D) Closed block by 1 μM Y3+, with 2 mM extracellular Ba2+ instead of Ca2+, shown as in A and B, from the same cell.

