Figure 6.
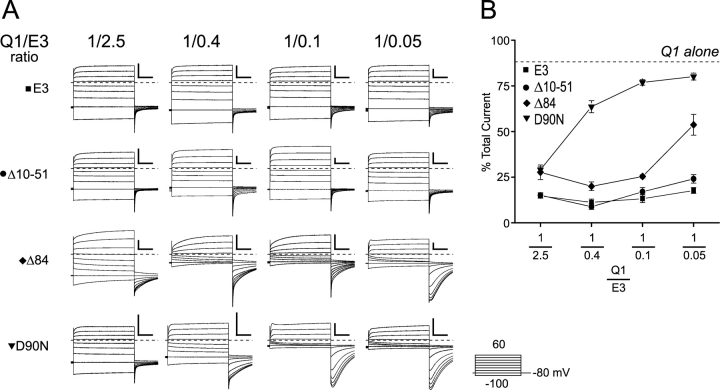
KCNE3 COOH-terminal mutants demonstrate a functional dependence on cRNA injection ratios. (A) Representative two-electrode voltage clamp recordings taken from oocytes injected with varying amounts of E3, between 2.5x and 0.05x of Q1. Currents were recorded in KD98, using a 13-s interpulse interval. The Q1:E3 ratio is labeled across the top. Top row, E3 (square); second row, Δ10-51 (circle); third row, Δ84 (diamond); bottom row, D90N (triangle). Dashed lines indicate zero current. Scale bars represent 1 μA and 0.5 s. Inset, “Activation Curve Protocol” of 2-s depolarizations used to elicit currents shown. (B) Percent current remaining after inhibition with 10 μM chromanol 293B. Oocytes were held at −80 mV and depolarized for 2 s to + 40 mV with a 28-s interpulse interval. Current levels were allowed to stabilize for ≤5 min before 10 μM chromanol 293B was perfused in. Chromanol inhibition typically reached equilibrium within 5 min of wash in. Dashed line indicates the percentage of current remaining in oocytes expressing Q1 alone. Data was averaged from 3–11 oocytes ± SEM.

