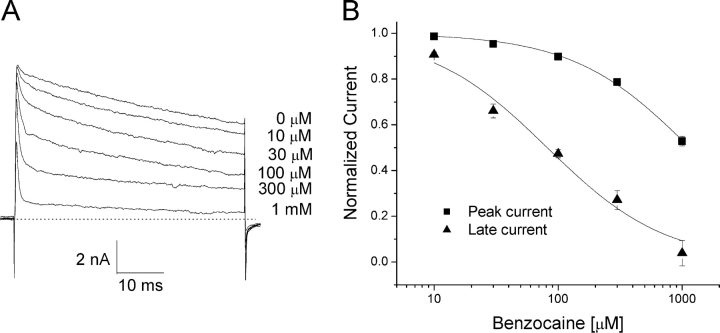
Figure 4.
Block of rNav1.4-WCW Na+ currents by benzocaine. (A) Representative current traces are shown at various benzocaine concentrations. Cells were depolarized by a 50-ms test pulse at +30 mV. Pulses were delivered at 60-s intervals. (B) Peak currents and maintained late currents at the end of the test pulse as shown in A were measured at various benzocaine concentrations. Data were normalized to the control saline response and fitted with the Hill equation. The IC50 value for the peak current was 1.16 ± 0.05 mM (Hill coefficient, 0.9 ± 0.1) (▪, n = 5). For the maintained current, the IC50 was 81.7 ± 10.7 μM (0.9 ± 0.1) (▴, n = 5).

