Figure 6.
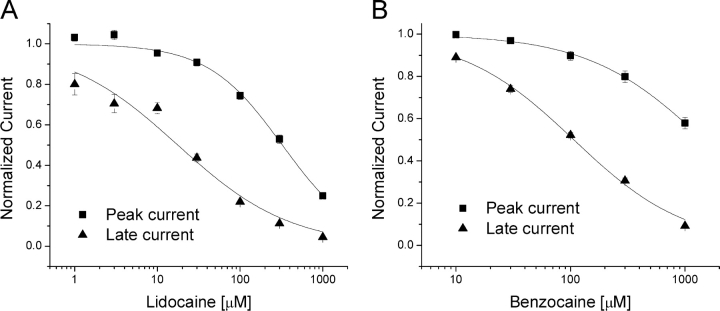
Block of rNav1.4-WCW Na+ currents by lidocaine or by benzocaine without external Na+ ions. Cells were depolarized by a 50-ms test pulse at +30 mV. Pulses were delivered at 60-s intervals. Holding potential was set at −140 mV. (A) Dose–response curve of lidocaine is shown without external Na+ ions. Peak currents from the beginning of the test pulse and maintained late currents at the end of the pulse were measured as described in Fig. 3. Data were normalized to the control, plotted against lidocaine concentration, and fitted with the Hill equation. The IC50 value for the peak current was 324 ± 26 μM (Hill coefficient, 0.97 ± 0.07) (▪, n = 5). The IC50 for the maintained late current was 17.6 ± 3.2 μM (0.63 ± 0.07) (▴, n = 5). (B) Dose–response curve of benzocaine is shown without external Na+ ions. Peak and maintained late currents were measured as described in Fig. 4, normalized, plotted against benzocaine concentration, and fitted with the Hill equation. The IC50 for the peak current was 1.45 ± 0.07 mM (0.86 ± 0.03) (▪, n = 5). The IC50 for the maintained late current was 107 ± 6 μM (0.88 ± 0.04) (▴, n = 5).

