
Figure 7.
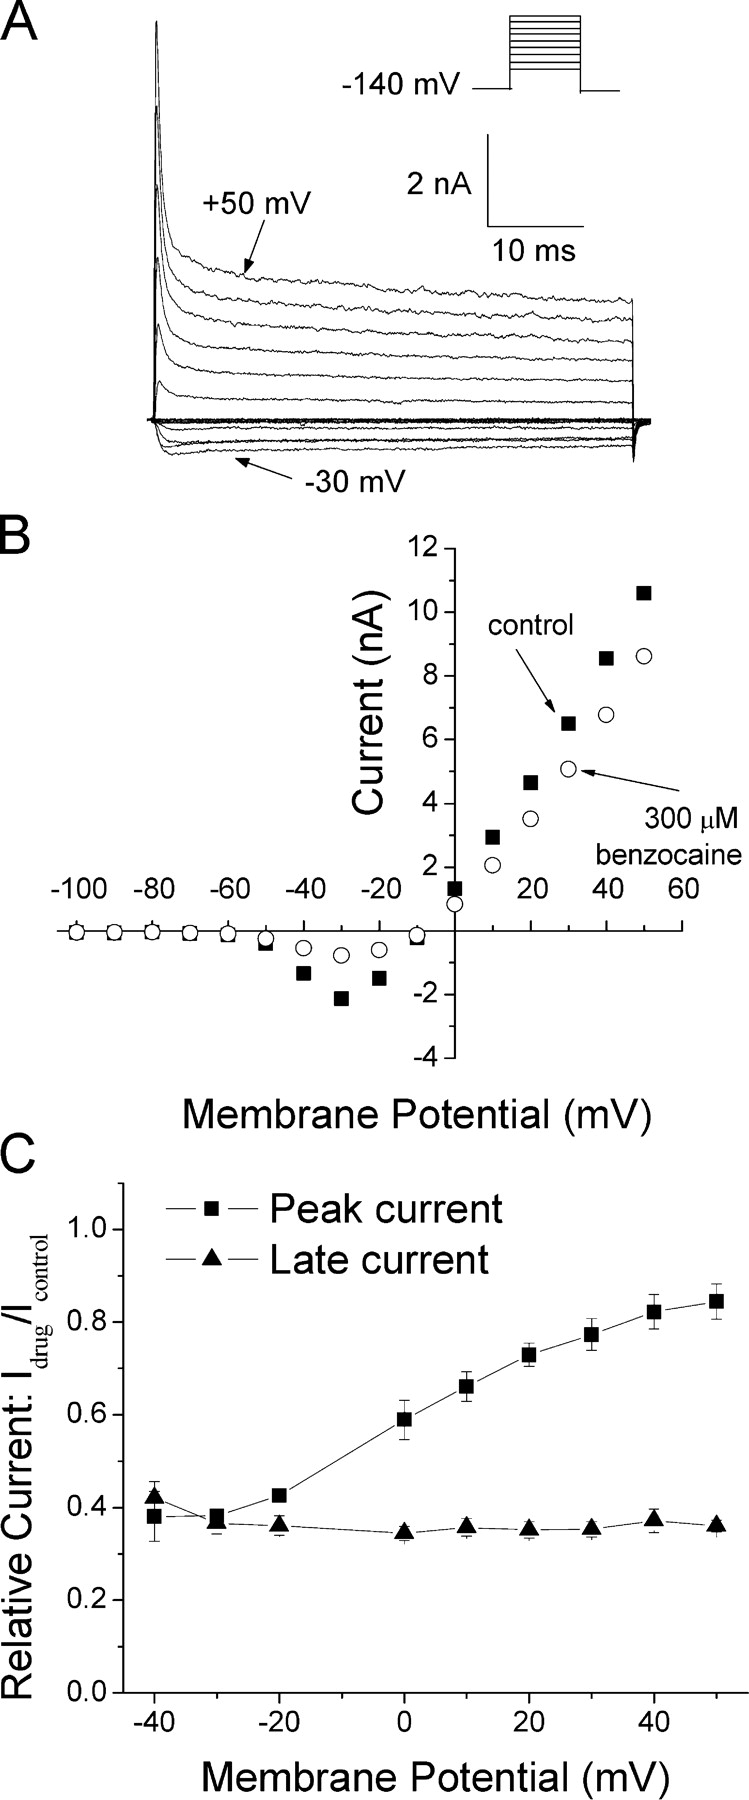
Current–voltage relationship in the presence of 300 μM benzocaine. (A) A representative family of Na+ currents were evoked by 50-ms test pulses increasing in 10-mV increments from −100 to +50 mV (pulse protocol shown in inset) in the presence of 300 μM benzocaine. Holding potential was set at −140 mV. Control data similar to those illustrated in Fig. 1 A in the absence of drug were not shown. (B) Peak currents for control (▪) and 300 μM benzocaine (○) were plotted against membrane voltage. (C) Both peak (▪, n = 4) and persistent (▴, n = 4) late currents at the end of the test pulse as shown in A were measured, normalized to peak currents measured from the same cell in control saline (Idrug/Icontrol), and plotted against membrane voltage.