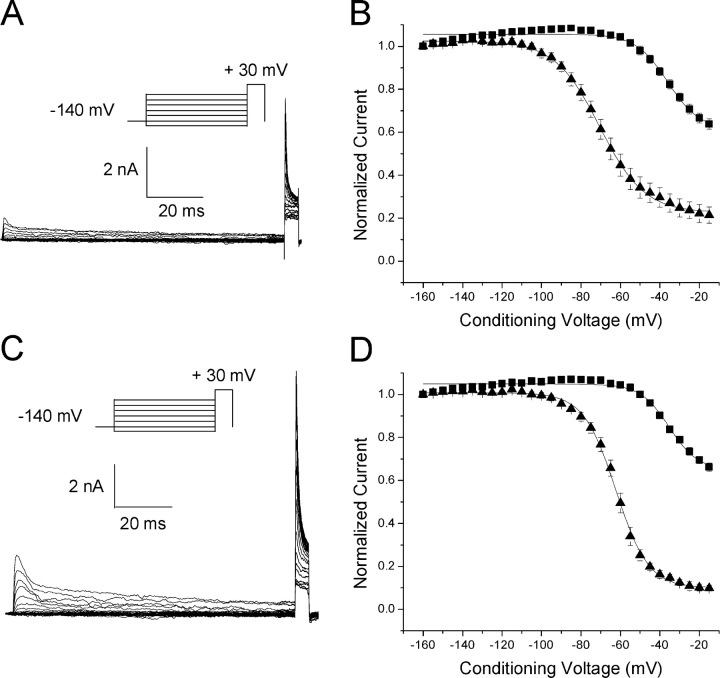
Figure 9.
Conventional h∞ measurement of rNav1.4-WCW Na+ channels with LAs presence. (A) Superimposed current traces were evoked by a 5-ms test pulse to +30 mV in the presence 300 μM benzocaine. Test pulses were preceded by 100-ms conditioning pulses, ranging from −160 to −15 mV in 5-mV increments (inset). Notice that Na+ currents were activated at the conditioning pulse >−50 mV. (B) Peak currents at the test pulse of +30 mV were measured, normalized, and plotted as a function of the conditioning voltage. The plot was fitted with a Boltzmann function (1/[1 + exp((V0.5 − V)/k)]). The average midpoint (V0.5) and slope (k) for the control were −36.0 ± 1.77 mV and 8.2 ± 1.2 mV, respectively (▪, n = 5), and for the cells treated with benzocaine were −70.5 ± 0.4 mV and 11.3 ± 0.3 mV, respectively (▴, n = 5). (C) Currents were evoked as described (A) in the presence of 300 μM lidocaine. (D) Normalized Na+ current availability, plotted as in B, and fitted with a Boltzmann function. The average midpoint (V0.5) and slope (k) for the control were −35.3 ±1.5 mV and 7.3 ± 1.0 mV, respectively (▪, n = 6), and for cells treated with lidocaine were −62.3 ± 0.3 mV and 8.2 ± 0.3 mV, respectively (▴, n = 6). All cells were perfused with external solution containing no Na+ ions.

