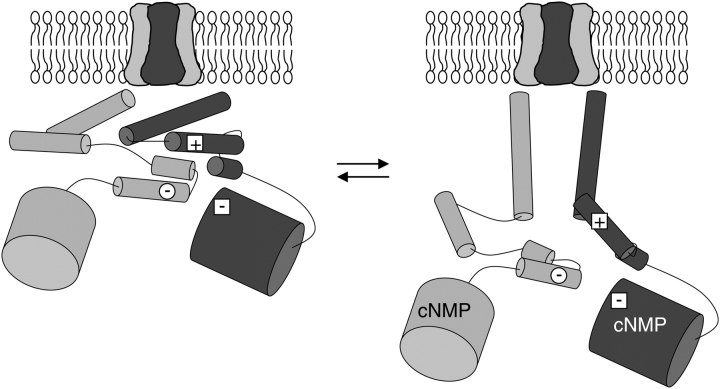
Figure 10.
Model for COOH-terminal region in the resting and activating configurations. Cartoons of HCN2 COOH-terminal region from the side view, both in the resting configuration (left) and the active configuration (right). COOH-terminal regions of two subunits (dark and light gray) are shown below the membrane-spanning portion of the channel. α helices are shown with narrow cylinders, and the β rolls of the CNBDs are shown with wide cylinders. Salt bridge residues are shown: the positive B' helix residue (plus sign within a square) and the two negative residues on the D' helix and the β roll (minus signs within a circle or square, respectively).

