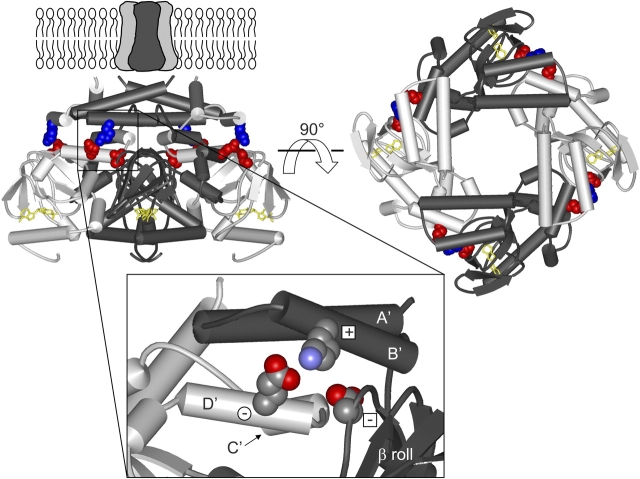
Figure 1.
Structure of HCN2 C-linker and CNBD. Structure of the HCN2 COOH-terminal region (Zagotta et al., 2003), viewed from the side (left) and from the membrane (right). The structure is positioned below the membrane-spanning portion of the channel, as it is thought to be in vivo. The structure contains four subunits, two in dark gray and two in light gray, with the C-linkers making up the top half of the structure and the CNBDs the bottom half. cAMP (yellow) is bound in the CNBD of each subunit. Residues of the putative salt bridges are shown in CPK format: K472 (blue), E502 and D542 (both in red). Enlargement of the region with these salt bridges (inset). Only two subunits are shown here, with the A'–D' helices and β roll labeled, and the residues are now colored according to their elements (carbon, gray; nitrogen, blue; and oxygen, red). Plus sign within a square is K472, minus sign within a square is D542 from the same subunit, and minus sign within a circle is E502 from the neighboring subunit.

