
Figure 2.
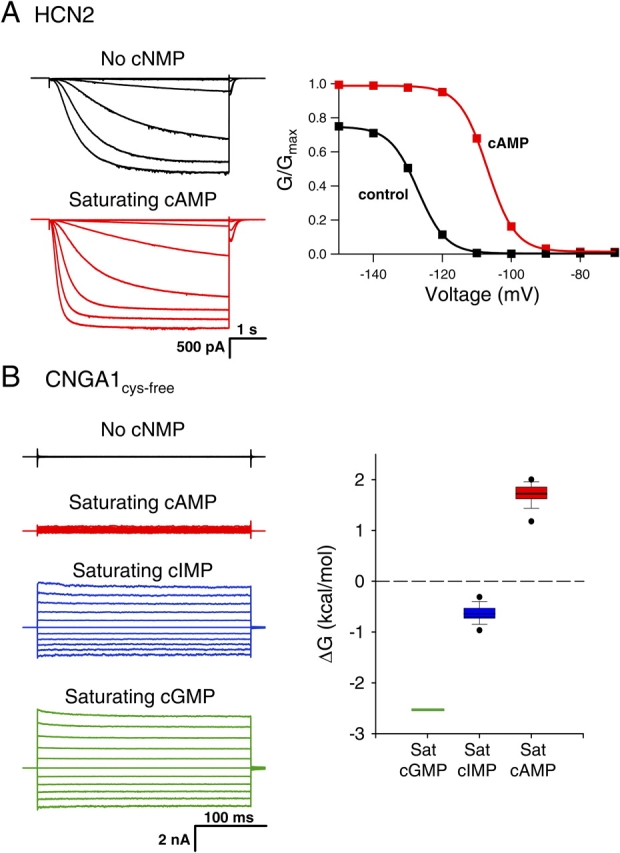
Behavior of wild-type HCN2 and CNGA1cys-free channels. (A) Behavior of wild-type HCN2 channels. Currents (left) and conductance–voltage relations (right) are shown in the absence (black) and presence of saturating cAMP (red). The currents were recorded in response to voltage pulses from a holding potential of 0 mV to test potentials between −70 and −150 mV, returning to a tail potential of −40 mV, and the conductance–voltage relations were obtained from normalized tail currents. (B) Behavior of CNGA1cys-free channels. Leak-subtracted currents (left) in response to voltage pulses from a holding potential of 0 mV to test potentials from −100 to +100 mV are shown in the absence (black, not leak subtracted) and presence of saturating cAMP (red), cIMP (blue), and cGMP (green). Box plot (right) of the ΔG for the opening transition with bound cGMP, cIMP, and cAMP. Center line is the median of the data, box is the 25th to 75th percentile of the data, and whiskers are the 5th and 95th percentile of the data. Outliers are shown as symbols.