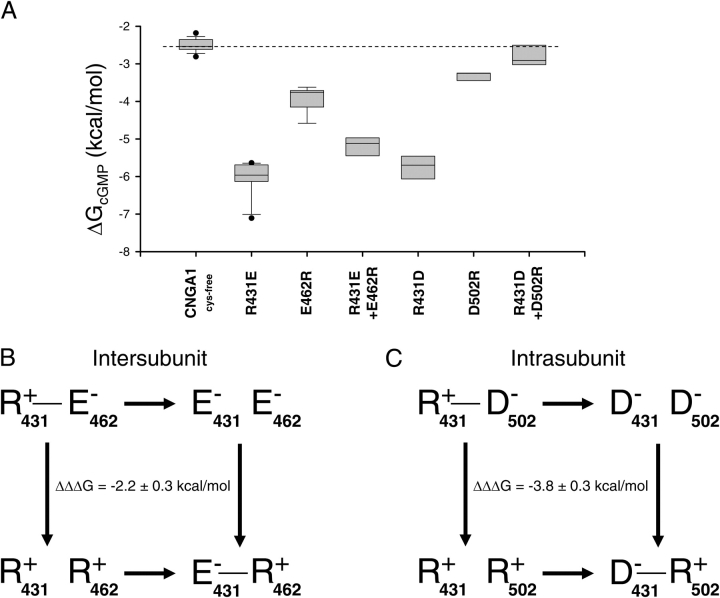
Figure 7.
Thermodynamic mutant cycle analysis for CNGA1 channels. (A) Box plot of ΔGcGMP values for CNGA1cys-free and mutant CNGA1 channels. The dashed line indicates the median ΔGcGMP value for CNGA1cys-free. (B and C) Thermodynamic mutant cycles for the intersubunit salt bridge (B) and intrasubunit salt bridge (C). The letters are the amino acid abbreviations for the residues, the number indicates the residue number, and the charge of the residue is also shown. The lines indicate when a salt bridge is possible between residues with opposite charges. ΔΔΔG values were calculated from ΔG values (see materials and methods) and are shown as mean ΔΔΔG ± SEM of ΔΔΔG.

