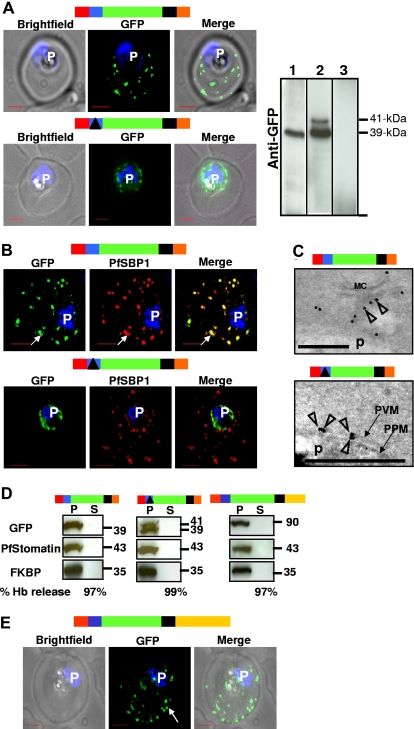
Figure 3.
The HT motif targets proteins to Maurer's clefts without translocation into the erythrocyte cytoplasm. (A) Live infected erythrocytes expressing HT-GFPmembmyc (top) and Δ-GFPmembmyc (bottom) viewed under bright-field image, GFP fluorescence, and merged optics. Western blot using antibodies to GFP indicating the detection of 39-kDa fusion product for HT-GFPmembmyc-expressing cells (lane 1), 39/41-kDa doublet fusion product for Δ-GFPmembmyc-expressing cells (lane 2), or no signal for untransfected cells (lane 3) is shown at the right. In lane 2, the 41-kDa band is a precursor that in pulse chase experiments can be chased into the 39-kDa band (data not shown). Vertical lines have been inserted to indicate repositioned gel lanes. (B) Indirect immunofluorescence assay showing distribution of GFP (green), associated with HT-GFPmembmyc (top panel) or Δ-GFPmembmyc (bottom panel) relative to the Maurer's cleft protein PfSBP1 (red). Parasite nucleus (p) is stained with Hoechst 33342. (C) Localization of HT-GFPmembmyc in Maurer's clefts (MC, top) and Δ-GFPmembmyc in parasitophorous vacuolar membrane (PVM, bottom) by immunoelectron microscopy. Empty arrowheads indicate gold particles showing distribution of GFP chimeras. Bar, 500 nm; p, parasite. Micrograph at the bottom has been magnified twice compared with that at the top to distinguish the parasite plasma membrane (PPM) from the PVM. (D) Western blots of tetanolysin-released infected erythrocyte cytoplasm supernatant (S) and pellet (P) fractions of cells expressing HT-GFPmembmyc (left panel), Δ-GFPmembmyc (middle panel), and HT-GFPmembC-term (right panel) probed for GFP, PVM marker PfStomatin, and parasite cytoplasmic protein PfFKBP. Hemoglobin (Hb) released (in S) by tetanolysin is expressed as a percentage of the total Hb detected by hypotonic lysis. (E) Live infected erythrocytes expressing HT-GFPmembCterm viewed under bright-field image, GFP fluorescence, and merged optics. Schematic representation for all constructs are indicated above with ER-type signal sequence (red), sequence containing HT signal (blue) or its replacement (solid black triangle) fused to GFP (green), transmembrane region (black), and myc (orange). C-terminal region (derived from PfEMP1) is depicted in yellow.

