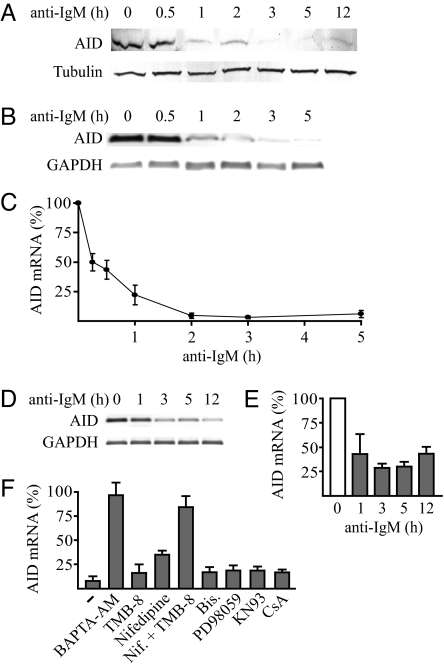
Fig. 1.
BCR activation with anti-IgM down-regulates AID expression, and the reduction is Ca2+ signaling-dependent. (A) Expression of AID protein in B lymphocytes from mouse spleen after activation of the gene with IL-4 (5 ng/ml) and LPS (10 μg/ml) for 48 h followed by addition of anti-IgM for the indicated times. The levels of AID and of α-tubulin used as loading control were determined by Western blot analysis. (B) AID mRNA levels of mouse B lymphocytes activated as in A and anti-IgM-treated for the indicated times determined by PCR and agarose gel electrophoresis of synthesized cDNA strands. The mRNA levels of glyceraldehyde-3-phosphate dehydrogenase (GAPDH) are shown as controls. (C) AID mRNA levels of mouse B lymphocytes activated as in A and anti-IgM-treated for the indicated times determined by quantitative RT-PCR and normalized by using the mRNA levels of GAPDH. The level before addition of anti-IgM was set at 100%. Results are mean ± SD (n = 4). (D) Expression level of AID mRNA during 12 h of treatment of the AID-expressing human lymphoma cell line DG75 with anti-IgM determined by PCR and agarose gel electrophoresis of synthesized cDNA strands. GAPDH is shown as control. (E) AID mRNA levels of the anti-IgM-treated DG75 cells determined by quantitative RT-PCR and normalized by using the mRNA levels of GAPDH. Gray bars represent cells treated with anti-IgM and the open bar represents cells not treated with anti-IgM. The level before addition of anti-IgM was set at 100%. Results are mean ± SD (n = 3). (F) Effects of different inhibitors of BCR signaling pathways on expression of AID mRNA in B lymphocytes from mouse spleen activated by IL-4 and LPS. Anti-IgM was added to one-half of cells treated with BAPTA-AM (12.5 μM), TMB-8 (50 μM), Nifedipine (50 μM), TMB-8 plus Nifedipine (Nif.), Bisindolylmaleimide I (Bis.; 0.1 μM), PD98059 (100 μM), KN93 (20 μM), or cyclosporin A (CsA)-treated (0.2 μM) and untreated (-) B lymphocytes for 3 h, followed by quantitative RT-PCR as in C. Values represent normalized AID mRNA levels with anti-IgM, as percentage of the levels without anti-IgM. Results are mean ± SD (n ≥ 3).

