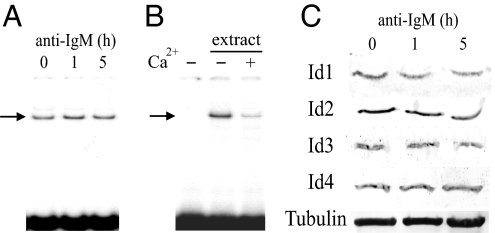
Fig. 3.
Constant DNA binding activity of E-proteins in the absence of Ca2+ and constant Id protein expression levels after engagement of the BCR with anti-IgM. (A) Amounts of E-protein DNA complex (indicated with arrow), using a probe containing an E-protein binding site from the AID enhancer, before anti-IgM treatment and after 1 and 5 h of treatment of DG75 cells. Nuclear extracts were analyzed by electrophoretic mobility shift assay (EMSA) in the presence of the chelator EDTA (0.5 mM). (B) Inhibition of formation of the E-protein DNA complex in the presence of Ca2+ (0.5 mM CaCl2) in EMSA as in A. The first lane was without addition of nuclear extract. (C) Id1, Id2, Id3, and Id4 protein expression levels during 5 h of BCR activation of DG75 with anti-IgM, determined by Western blot analysis. Levels of α-tubulin were used as loading controls.

