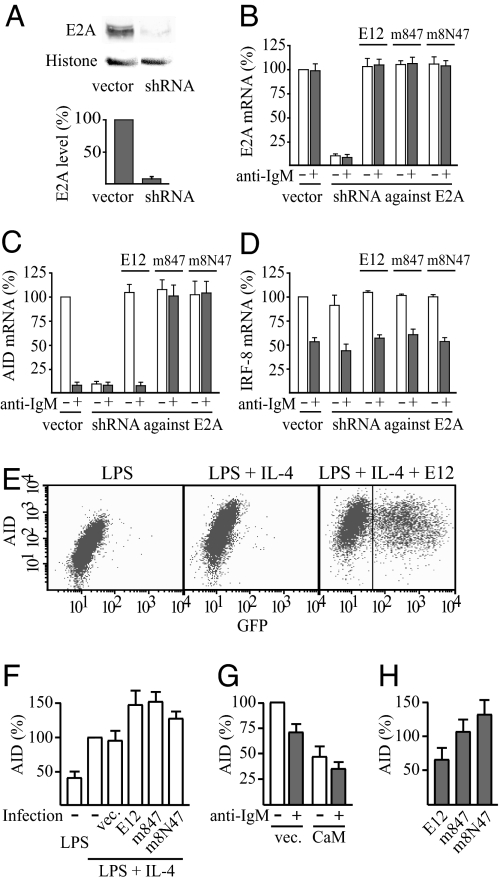
Fig. 5.
Loss of anti-IgM sensitivity of AID expression by expression of calmodulin-resistant E12. (A) Reduced expression of E2A in DG75 cells by a shuttle vector that expresses short hairpin RNA (shRNA) targeting both E12- and E47-splice forms of human E2A mRNA. A typical Western blot and mean ± SD of quantification (n = 3) are shown. (B–D) Effects of the shuttle vector that expresses short hairpin RNA (shRNA) interfering with human E2A mRNA, and complementation by expression of wild-type or mutant mouse E12, on the expression of E2A (B), AID (C), and IRF-8 (D) mRNA. DG75 (1 × 10⁷ cells) was transfected with 5 μg of pMEP4 shuttle vector expressing shRNA against human E2A mRNA or the empty vector or with 5 μg of the shRNA expression vector plus 0.5 μg of the corresponding pMEP4 vector expressing wild-type or calmodulin-resistant mutant of mouse E12, all added together with 25 μg of EBNA expression plasmid. Where indicated, cells were treated with anti-IgM for 3 h before the harvest. The expression level of E2A, AID, or IRF-8 mRNA, respectively, in cells transfected with empty pMEP4 vector and not treated with anti-IgM was set at 100%. Results are mean ± SD (n = 3). (E) Expression of AID protein in B lymphocytes from mouse spleen after activation with LPS (10 μg/ml) and where indicated also with IL-4 (5 ng/ml) for 75 h. (Right) Cells infected with retrovirus encoding E12 followed by an internal ribosome entry site (IRES) and green fluorescent protein (GFP) after 24 h of the incubation with the activators. The levels of AID and GFP were determined by intracellular immunostaining and flow cytometry. (F–H) Average AID protein expression levels of cells from experiments such as those shown in E and corresponding infections with retrovirus encoding wild-type E12, m847, or the m8N47 mutant, calmodulin, or the empty retrovirus vector. Cells with a GFP fluorescence exceeding 43 (indicated in E Right) were considered as retrovirus-infected and used to calculate average AID expression levels of infected cells. Results are mean AID immunostaining fluorescence intensity ± SD. (n = 3). (F) The level in noninfected cells activated with both LPS and IL-4 was set at 100%. (G) The level in control cells infected with empty retrovirus vector (vec.) and not treated with anti-IgM was set at 100%. (H) AID expression levels of infected cells treated with anti-IgM for 3 h are expressed as percentage of the levels of the corresponding infected cells not treated with anti-IgM.

