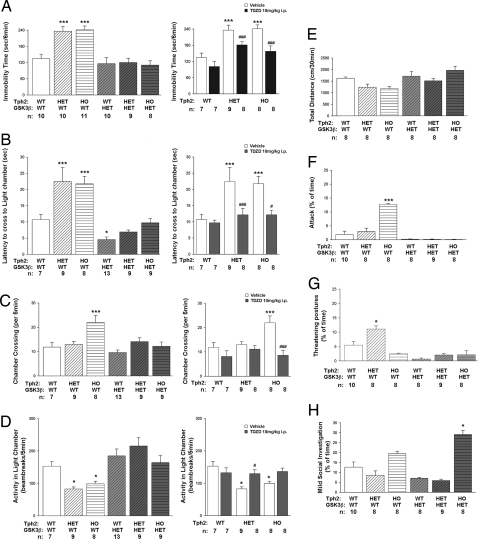
Fig. 4.
Reduction of GSK3β activity antagonizes behavioral changes in R439H Tph2 mice. (A) Immobility times in tail suspension for vehicle-treated mice from the six genotypes (Left) and for Tph2 knockin mice treated with 10 mg/kg TDZD-8 (i.p.) the GSK3β inhibitor (Right). Data are presented as total immobility time for the 5-min test. [ANOVA, FGenotype(5,52) = 11.481, P < 0.001; TDZD ANOVA, FGenotype(2,41) = 21.775, P < 0.001; FDrug = ns; FGenotypexDrug(2,41) = 11.196, P < 0.001]. (B–D) Dark–light emergence test evaluating latency to the first cross to the lighted chamber [ANOVA, FGenotype(5,49) = 13.564, P < 0.001; TDZD ANOVA, FGenotype(2.41) = 4.595, P < 0.016; FDrug(1.41) = 10.986, P < 0.002; FGenotypexDrug(2,41) = 3.601, P < 0.036] (B), number of crosses to lighted chamber [ANOVA, FGenotype(5,49) = 6.301, P < 0.001; TDZD ANOVA, FGenotype(2.41) = 3.477, P < 0.040; FDrug(1.41) = 14.920, P < 0.001; FGenotypexDrug(2.41) = 4.980, P < 0.012] (C), and locomotor activity in the lighted chamber [ANOVA, FGenotype(5,49) = 6.493, P < 0.001; TDZD ANOVA, FGenotype(2.41) = 5.456, P < 0.008; FDrug(1.41) = 3.982, P < 0.049; FGenotypexDrug(2,41) = 4.794, P < 0.013] (D) in vehicle-treated mice from the six genotypes (Left) and for Tph2 knockin mice treated with 10 mg/kg TDZD-8 (i.p.) (Right). (E) Basal locomotor activities in vehicle-treated mice from the six genotypes. Mice were placed into the open field, and the distance traveled was monitored over 30 min. (F–H) Parameters of social interaction in the dyadic test. (F) Attacks [ANOVA, FGenotype(5,45) = 8.101 P < 0.001]. (G) Threatening postures [ANOVA, FGenotype(5,45) = 2.875 P < 0.025]. (H) Mild exploratory behaviors [ANOVA, FGenotype(5,45) = 24.722 P < 0.001]. For all behavioral tests, balanced groups of male and female mice were used, with the exception of the social interaction test, where only males where used. Data are shown as means ± SEM. *, P < 0.05; ***, P < 0.005, as compared with WT mice; #, P < 0.05; ###, P < 0.005, as compared with vehicle-treated mice from the same genotype, ANOVA with Bonferoni corrected pair-wise comparisons. Numbers of animals for each condition (n) are indicated.

