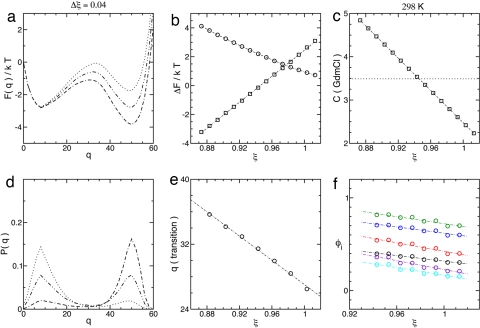
Fig. 2.
ξ dependence of landscape parameters. (a) Free energy profile across the melting transition, ξm ≃ 0.946. (b) Melting free energy ΔF‡-D (□) and transition state barrier ΔF‡-D (○). (c) Mapping between stability values and denaturant concentration at 25°C. The dotted line indicates the melting concentration cm ≃ 3.49 M GdmCl. Data points occur at integer multiples of Δξ = 0.01 (Δc ≃ 0.186) about ξ ≃ 0.943. (d) Distribution of states P(q) corresponding to a. The stability range corresponds to the FRET data in figure 6 of ref. 18. (e) Location of the transition q‡(ξ). The data points were calculated by fitting the barrier to a quadratic. (f) φ values for the degree of helix formation as in figure 5 of ref. 17 (the color scheme is the same, and the plot describes a similar range of stability). φi(ξ) variations for tertiary structure are slightly larger.

