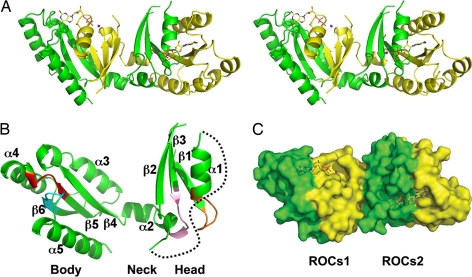
Fig. 1.
The unique dimeric ROC GTPase. (A) Stereoview of the domain-swapped dimer. The two individual monomers are shown in yellow and green. The GDP-Mg2+ ligands are shown in ball-and-stick format. (B) Ribbon representation of a single monomer. The three head, neck, and body subdomains are indicated, along with the labeled secondary structures. The P-loop, G3/Switch II, and G4 and G5 loops are indicated in orange, pink, red, and cyan, respectively. The disordered G2 loop is shown as a black dotted curve. (C) Surface representation highlighting the GDP-Mg2+ binding pocket on the surface of the dimer that is contributed from both monomers. The pair of functional units are shown as ROCs1 and ROCs2, respectively.

