Fig. 2.
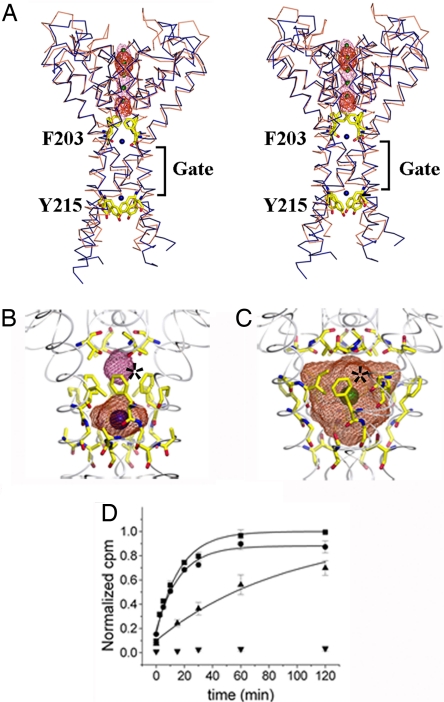
The pore domain. (A) Stereoview of MlotiK1 (blue) and KcsA (brown) pores. TMs S1–S5 are not shown. Phe-203 and Tyr-215 shown as yellow sticks. The difference electron-density maps are shown in red (Cs+) and pink (Rb+) mesh. K+ is shown as green spheres. Water molecules are shown as blue spheres. The bundle crossing gate region is indicated. (B) MlotiK1 cavities. Water-accessible volumes are shown as mesh. Residues lining the cavity are shown as sticks. The asterisk marks the Phe-203 side chains. Water molecules are shown as blue spheres. (C) KcsA cavity as in B. The green sphere represents K+. The asterisk indicates Phe-103 side chains. (D) Time course of MlotiK1 activity as monitored by 86Rb+ flux assay. Wild types and mutants, F203A and Y215A, were assayed for activity in the presence of saturating cAMP. The points and error bars show mean and SD for three measurements. The data were fit to the single exponential, and the time constants were determined: F203A, 16.7 ± 1.8 min; Y215A, 24.6 ± 3.8 min; wild type, 94.4 ± 9.7 min. Triangles, wild type; squares, F203A; circles, Y215A; inverted triangle, control (liposomes without protein).

