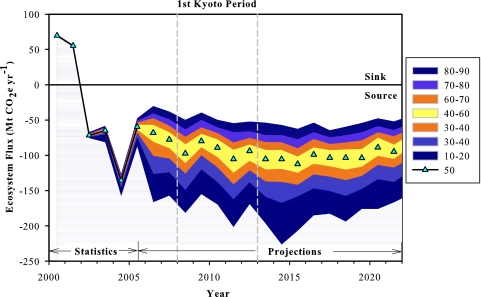
Fig. 1.
Annual net GHG balance (ecosystem flux) for Canada's managed forests. The model results are based on disturbance and management statistics for 2000–2005 and projections for 2006–2022. A small range in the estimates for 2003–2005 resulted from the need to fill some gaps in the available disturbance data with Monte Carlo projections. Monte Carlo simulations were used to project ecosystem GHG balance for future years, in which the area disturbed by fire and insects is not yet known, resulting in the wide range of projected estimates. The 50th percentile estimate for each year is indicated with a cyan triangle, and colors indicate the areas representing the range of estimates between the 10th and 90th percentiles. Negative GHG balance represents a net flux from the forest to the atmosphere (net GHG source).

