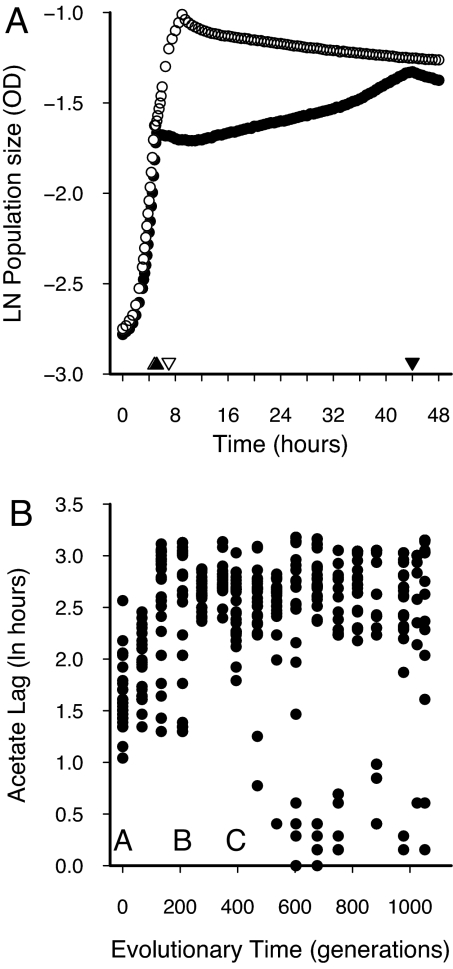
Fig. 1.
Population growth profiles for FS and SS ecotypes on glucose and acetate and evolutionary change in acetate lag in an E. coli population. (A) FS (open symbols) and SS (filled symbols) ecotypes sampled after 1,000 generations of evolution consume glucose during the first stage of growth, then switch to acetate for the remainder of each 24-h batch culture. Acetate lag is the difference in hours between the switching point, or diauxic shift, between the two resources (triangles) and the maximum growth rate on acetate (inverted triangles). (B) The time from the switching point to the maximum growth rate on acetate (see A), or acetate lag, increases from the ancestral state (generation 0) to the branching point (generation 395), where the population splits into two characteristic ecotypes, SSs with a long acetate lag and FSrs with a short acetate lag. Data points represent randomly selected isolated genotypes from the frozen evolutionary record of the population. Letters on the x axis represent the ancestral (A), midpoint (B), and MRCA (C) subpopulations used in the rediversification experiment.

