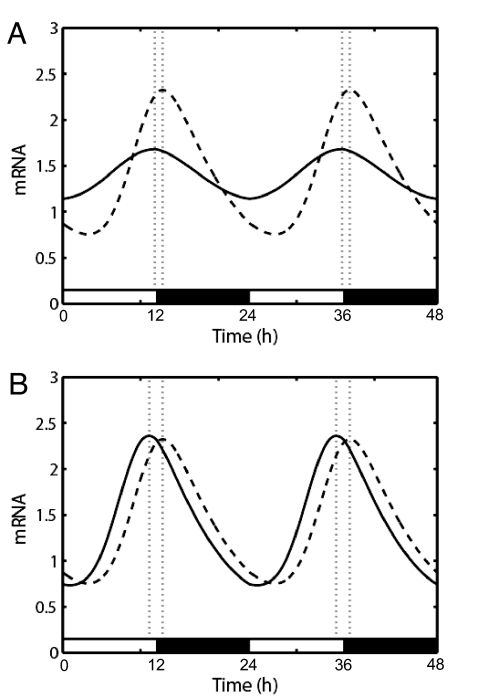
Fig. 3.
Theoretical modeling of the effects of clock properties upon entrained phase. (A) Graph of the circadian oscillations of mRNA in a 12 h:12 h light:dark cycle for two hypothetical oscillators in which the amplitude of transcription varies 2-fold. Dashed line, high-amplitude oscillator; solid line, low-amplitude oscillator. The resultant difference in entrained phase (dotted lines) is 1 h. In this scenario, the high-amplitude oscillator was created by setting h = 14, and the low-amplitude by setting h = 11 (see SI Materials and Methods for a description of mathematical methodology and variables used). (B) Similar graph for two hypothetical oscillators in which the amplitude of perceived phase shifting (i.e., light) varies 2-fold. Dashed line, lesser perceived light; solid line, more perceived light. The resultant difference in entrained phase (dotted lines) is 1.7 h. The curve from lesser perceived light was obtained with a = 0.015, and that from more perceived light used a = 0.03.

