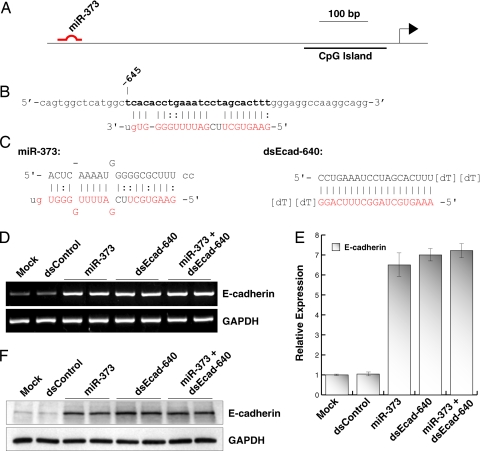
Fig. 1.
miR-373 induces gene expression by targeting a complementary sequence in the E-cadherin promoter. (A) Schematic representation of the E-cadherin promoter and its CpG island. Indicated is the location of the miR-373 target site. (B) Sequence of the miR-373 target site located at nucleotide −645 relative to the transcription start site. Bases in boldface indicate the target site in the sense strand of promoter DNA. The sequence in red corresponds to those bases in miR-373 that are complementary to the target site, including G:U/T wobble base-pairing. (C) Sequence and structure of miR-373 and dsEcad-640. Lowercase letters in both strands of miR-373 correspond to the native two-base 3′ overhangs. Sequences in red correspond to those bases that are complementary to the target site. (D) PC-3 cells were transfected with 50 nM concentrations of the indicated dsRNAs for 72 h. Combination treatment of miR-373 and dsEcad-640 (miR-373 + dsEcad-640) was performed by transfecting at 50 nM each dsRNA. Mock samples were transfected in the absence of dsRNA. E-cadherin and GAPDH mRNA expression levels were assessed by standard RT-PCR. GAPDH served as a loading control. (E) Relative expression of E-cadherin was determined by real-time PCR (mean ± standard error from four independent experiments). Values of E-cadherin were normalized to GAPDH. (F) Induction of E-cadherin protein was confirmed by immunoblot analysis. GAPDH was also detected and served as a loading control.

