Figure 4.
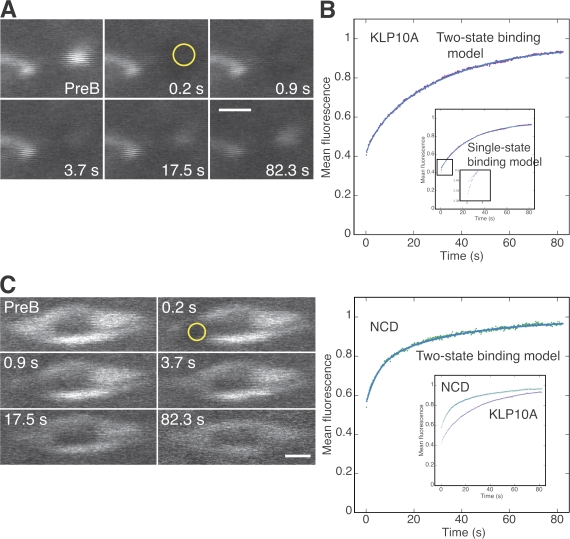
FRAP analysis of KLP10A-GFP at pole bodies. (A and C) Images from FRAP assays (Videos 1 and 2, available at http://www.jcb.org/cgi/content/full/jcb.200711031/DC1) of KLP10A-GFP at a pole body (A) and NCD-GFP in a meiosis I spindle (C) before bleaching and at exponentially increasing times during recovery. PreB, prebleach. Yellow circles indicate photobleached regions of interest (radius = 0.66 μm). (B and D) Mean fluorescence of the photobleached pole bodies (B; purple) or spindles (D; green) during recovery. Fluorescence was normalized to the first prebleach value, corrected for loss during imaging, and fit to kinetic models (blue); the two-state binding model fit well. (B, inset) Pole body data fit to the single-state binding model showed deviation at early points. (D, inset) KLP10A at pole bodies compared with NCD in spindles. Bars, 2 μm.

