Figure 1.
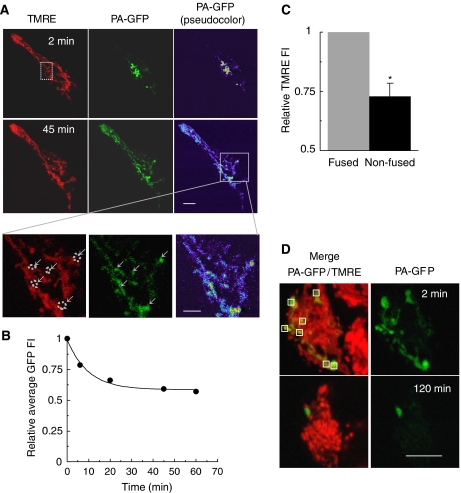
A subset of mitochondria have reduced fusion capacity. (A) INS1 cells were transduced with mtPA-GFP (green) and stained with TMRE (red). mtPA-GFP distribution is shown immediately (within 2 min) after photoactivation (area indicated by a dashed square) and in the plateau phase of mtPA-GFP spreading (45 min). Mitochondria that did not exhibit GFP FI decay (less than 5%) are marked by arrows. Upper scale bar, 10 μm; lower scale bar 5 μm. (B) Fusion events result in the spread of mtPA-GFP across the mitochondrial population, leading to its dilution and a decay in GFP FI value (n=16). (C) The relative difference in TMRE FI between non-fusing mitochondria and fusing mitochondria, calibrated against the whole-cell average. (D) Primary β-cells expressing mtPA-GFP were photoactivated in seven different regions (squares) and imaged after 2 min and again after 2 h of incubation. Scale bar, 10 μm. *P<0.001.

