Figure 4.
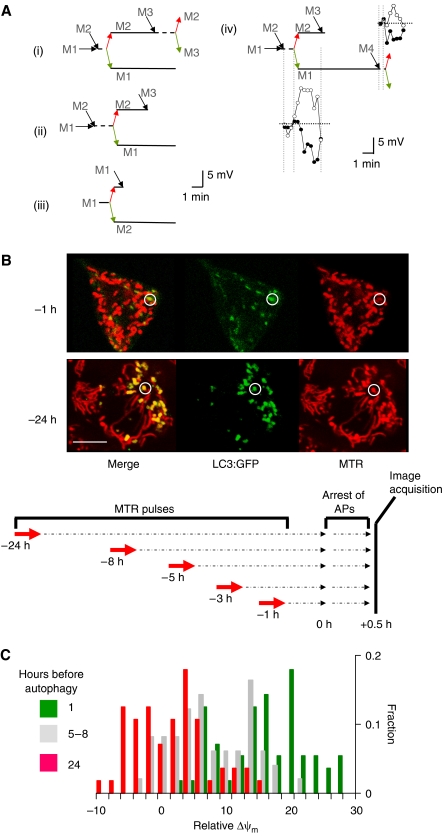
Consequences of fusion–fission events. (A) Schematic illustrations of mitochondrial tracking in four different experiments (i–iv) and corresponding Δψm traces (iv). Colored arrows indicate generation of hyperpolarizing (red) and depolarizing (green) daughters during fission. Note that after a fission event, fusion (black arrows) preferably occurred in the hyperpolarized daughter mitochondrion. (B) Depolarized mitochondria are selectively targeted for autophagy after a multi-hour time lag. APs are labeled with LC3:GFP, which translocates from the cytosol to the AP's isolation membrane. MTR, a membrane potential dye that stains mitochondria irreversibly and is retained during depolarization, is used to pulse label mitochondria in INS1 cells (14 min, 50 nM) at different time points before detection of APs content. At the time set for detection, cells were treated with pepstatin A (10 μM) and E64d (10 μM) for 30 min to arrest digestion inside the APs, and then subjected to confocal microscopy (see schematic illustration of the Materials and methods). MTR pulse is used here to report on Δψm during the staining period. While mitochondria outside APs show bright MTR fluorescence, those localized in APs varied in fluorescence based on the time at which they were pulsed with MTR. Note that mitochondria inside APs have dim MTR FI if they were pulsed with MTR 1 h before autophagy was detected (circle, top panel), but bright MTR FI if pulsed 24 h before detection of autophagy (circle, bottom panel). Scale bar, 10 μm. (C) Distribution of MTR FI (given in Δψm) of AP-localized mitochondria at different times before autophagy. Values are relative to cell's average MTR FI. In the x-axis, a zero value represents the average Δψm and positive values represent depolarized mitochondria.

