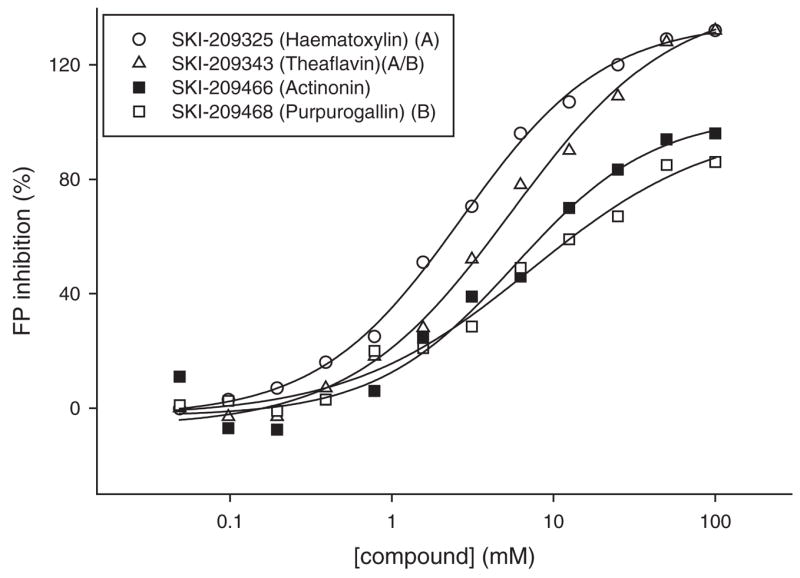
FIG. 10.

Dose response in the fluorescence polarization (FP) binding assay of selected compounds representative of each scaffold, compared to the reference inhibitor actinonin. The IC50s for each compound were hematoxylin, 2.7 μM; theaflavin, 6.1 μM; actinonin, 5.5 μM; and purpurogallin, 8.8 μM.
