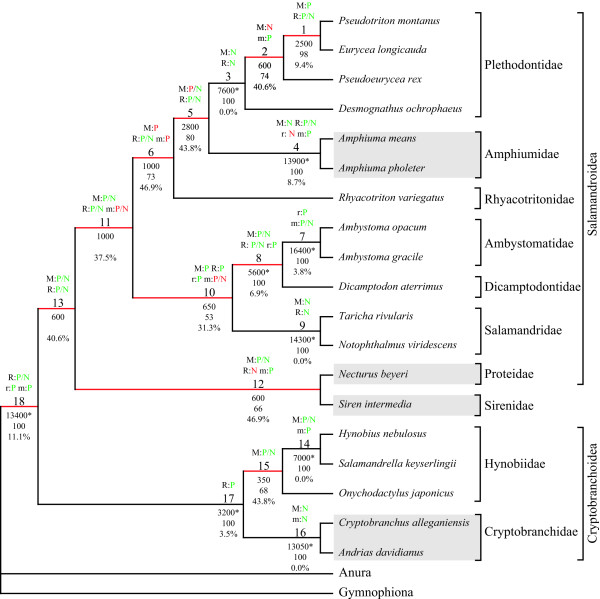
Figure 1.
Phylogenetic analysis of combined data and indicated conflicts. Most parsimonious tree of the analysis of all data [Tree length (TL) = 858,325; Number of trees (NT) = 1]. Red branches are incongruent to trees obtained in analyses of all possible combinations of partitions (Figs. 3–5). The labels at the branches indicate the following from top to bottom: 1st) Significant contribution (green) or conflict (red) indicated by PABA (P) or NDI (N) for morphology (M), RAG1 (R), rRNA (r) or mtDNA (m); 2nd) Node labels; 3rd) BS values, with significant ones based on the Templeton [70] test indicated by an asterisk; 4th) BP values above 50; 5th) Degree of conflict indication. Paedomorphic taxa are highlighted with grey boxes.

